Email Marketing Metrics That Actually Matter (And Which to Ignore)
Email marketing metrics are the quantitative signals used to evaluate how an email campaign or program is performing. The challenge is that most email platforms show 10–15 metrics, and only 4–5 of them actually drive useful decisions. The rest are either unreliable, vanity-driven, or useful only in specific contexts.
Quick Answer: The metrics that matter most: click rate, conversion rate, revenue per email, unsubscribe rate, and deliverability rate. Open rate is useful but increasingly unreliable due to Apple's Mail Privacy Protection. Subscriber count is a vanity metric unless paired with engagement data.
The Problem With Most Email Reporting
Email metrics exist in an environment distorted by:
Apple Mail Privacy Protection (MPP): Since 2021, Apple pre-fetches email content for all Apple Mail users, triggering "opens" whether or not the recipient actually read the email. This inflates open rates by 20–40% for most lists — and the inflation is invisible.
Vanity metrics: Subscriber count, send volume, and gross opens are impressive numbers that don't tell you whether email is generating business outcomes.
Context collapse: An 18% open rate is excellent for a cold list and alarming for a highly engaged loyalty list. Metrics only have meaning in context.
Tier 1: Metrics That Drive Decisions
Click Rate (CTR)
What it is: The percentage of delivered emails in which at least one link was clicked.
Why it matters: Clicks represent actual engagement. Unlike opens, clicks are harder to fake — a person had to read enough of the email to want to click something. Click rate is the best proxy for content quality and CTA effectiveness.
Formula: (Total unique clicks ÷ Delivered emails) × 100
Benchmark: 2–5% for most industries. Higher is better. Below 1% is a problem signal.
What to do with it:
- Low click rate on good list → problem with email content, CTA, or offer
- Low click rate + low open rate → subject line or deliverability problem
- Click rate dropping over time → audience relevance is slipping; check segmentation
Conversion Rate
What it is: The percentage of email recipients who completed the desired action — purchase, trial signup, demo booked, content download.
Why it matters: This is the ultimate measure of email effectiveness. Click rate says people were interested; conversion rate says people acted.
Formula: (Conversions ÷ Delivered emails) × 100
Benchmark: Varies dramatically by action type — 1–5% for purchases, 5–15% for content downloads, 10–25% for trial-to-paid (onboarding sequences).
Note: This requires connecting your email platform to your conversion data (via UTM parameters, pixel tracking, or native integrations). Many teams track opens and clicks but never close the loop on conversions — and miss the most important number.
Revenue Per Email (RPE)
What it is: Total revenue attributed to an email campaign, divided by the number of emails delivered.
Why it matters: The single most business-relevant email metric. Tells you not just if people clicked, but whether those clicks generated money.
Formula: Total attributed revenue ÷ Emails delivered
What it reveals:
- Which campaign types (promotional, nurture, sequence) generate the most revenue
- Whether your email list is actually valuable or just large
- How to prioritize your email calendar
Deliverability Rate
What it is: The percentage of sent emails that were accepted by the receiving mail server (not bounced).
Why it matters: If emails aren't reaching inboxes, nothing else matters. A deliverability rate below 95% indicates a problem — authentication issues, a dirty list, or reputation damage.
Formula: (Emails delivered ÷ Emails sent) × 100
Benchmark: 95%+ is good. 98%+ is excellent. Below 90% requires immediate investigation.
Related signals:
- Spam complaint rate: Keep below 0.08%
- Hard bounce rate: Keep below 2%
- Soft bounce rate: Watch for trends (a spike indicates a deliverability problem)
Unsubscribe Rate
What it is: The percentage of recipients who unsubscribed after receiving the email.
Why it matters: Unsubscribes are feedback. A spike after a specific campaign tells you something about that campaign was misaligned — wrong topic, wrong audience, wrong frequency, wrong offer.
Formula: (Unsubscribes ÷ Emails delivered) × 100
Benchmark: Below 0.2% per campaign is healthy. Above 0.5% is a warning sign. Above 1% on a specific campaign requires investigation.
Important: Unsubscribes are better than spam complaints. Someone who unsubscribes is telling you they don't want your emails. Someone who marks you as spam is telling email providers the same thing — but it also damages your deliverability.
Tier 2: Useful in Context
Open Rate
What it is: The percentage of delivered emails that were "opened."
Why it's complicated: Apple's Mail Privacy Protection has made this metric increasingly unreliable. Any open from Apple Mail is auto-triggered — regardless of whether the email was read. This inflates open rates on lists with many Apple users by 20–40%.
Is it still useful? Yes — for:
- Trending over time within the same audience (consistent conditions)
- A/B testing subject lines (comparing two variants to the same list eliminates the inflation bias)
- Identifying severely low engagement (a 5% open rate is still a problem even with inflation)
Don't use it for: Comparing across time periods where Apple's share of your list has changed, or as a primary success metric for campaigns.
List Growth Rate
What it is: How fast your email list is growing, net of unsubscribes and bounces.
Why it matters (sometimes): List growth tells you whether your acquisition funnel is working. A stagnant or shrinking list is a signal worth addressing.
Why it's dangerous as a primary metric: A rapidly growing list that's not engaged is worse than a slowly growing list of engaged subscribers. Track list growth alongside engagement rate, not instead of it.
Click-to-Open Rate (CTOR)
What it is: Clicks as a percentage of opens (not delivered emails).
Formula: (Clicks ÷ Opens) × 100
When it's useful: For evaluating whether the body content of an email is working, independent of subject line performance. Isolates content quality from open rate variability.
Benchmark: 10–20% is typical. But treat it with the same Apple MPP caution as open rate.
Tier 3: Watch, Don't Obsess
Subscriber Count
What it means: Total number of contacts on your list.
The trap: List size is the most commonly cited email vanity metric. A list of 100,000 with 5% engagement is less valuable than a list of 10,000 with 40% engagement. Never optimize for list size at the expense of list quality.
Average Order Value (Email-Attributed)
What it means: Average purchase value from orders attributed to email campaigns.
When it's useful: For e-commerce teams evaluating whether email is driving high-value purchases or just discount-seekers.
Building Your Email Reporting Dashboard
The simplest, most actionable email dashboard has these metrics:
| Metric | Frequency to Review | Decision It Informs |
|---|---|---|
| Deliverability rate | Weekly | List health and authentication status |
| Click rate (by campaign type) | Per campaign | Content and CTA quality |
| Conversion rate | Per campaign | Offer and targeting quality |
| Revenue per email | Monthly | Campaign prioritization |
| Unsubscribe rate | Per campaign | Content relevance and frequency |
| Spam complaint rate | Weekly | List quality and content |
Frequently Asked Questions
What is a good email open rate in 2025?
Due to Apple's Mail Privacy Protection inflating open rates, raw open rate benchmarks are less meaningful. For list-relative trending: 20–40% is typical for well-maintained lists, but your inflated rate may be higher. Focus on click rate (2–5% benchmark) as a more reliable engagement signal.
What email metric is most important?
For commercial email, conversion rate and revenue per email are the most important — they directly tie email to business outcomes. For engagement quality, click rate is the most reliable single metric. Deliverability rate is foundational — if it drops, everything else suffers.
Why is my email open rate so high?
If your open rate is unusually high (50%+), Apple's Mail Privacy Protection is likely the cause. MPP pre-fetches emails for Apple Mail users, recording an "open" even if the email was never read. This is increasingly common as Apple Mail market share grows.
What is click-to-open rate and why does it matter?
Click-to-open rate (CTOR) is clicks as a percentage of opens. It measures how well your email content converts readers who opened into clickers — isolating body content quality from subject line performance. A high open rate but low CTOR indicates a subject line that overpromised relative to the content inside.
How do I improve my email click rate?
The highest-impact changes: make your CTA more specific (not "click here" but "download the guide"), place the CTA higher in the email, reduce the number of competing links, and make sure the email body clearly earns the click before asking for it. Short, relevant body copy with a single goal outperforms long, multi-topic emails on CTR.
Conclusion
Good email analytics means ignoring the noise and focusing on the signals that connect email activity to business outcomes. Click rate, conversion rate, revenue per email, and deliverability are the core. Open rate is useful for trend tracking but not the primary success metric. Subscriber count tells you very little on its own.
Set up a reporting cadence (weekly for deliverability, per-campaign for engagement, monthly for revenue) and stick to it. The goal isn't a perfect dashboard — it's making better decisions faster.
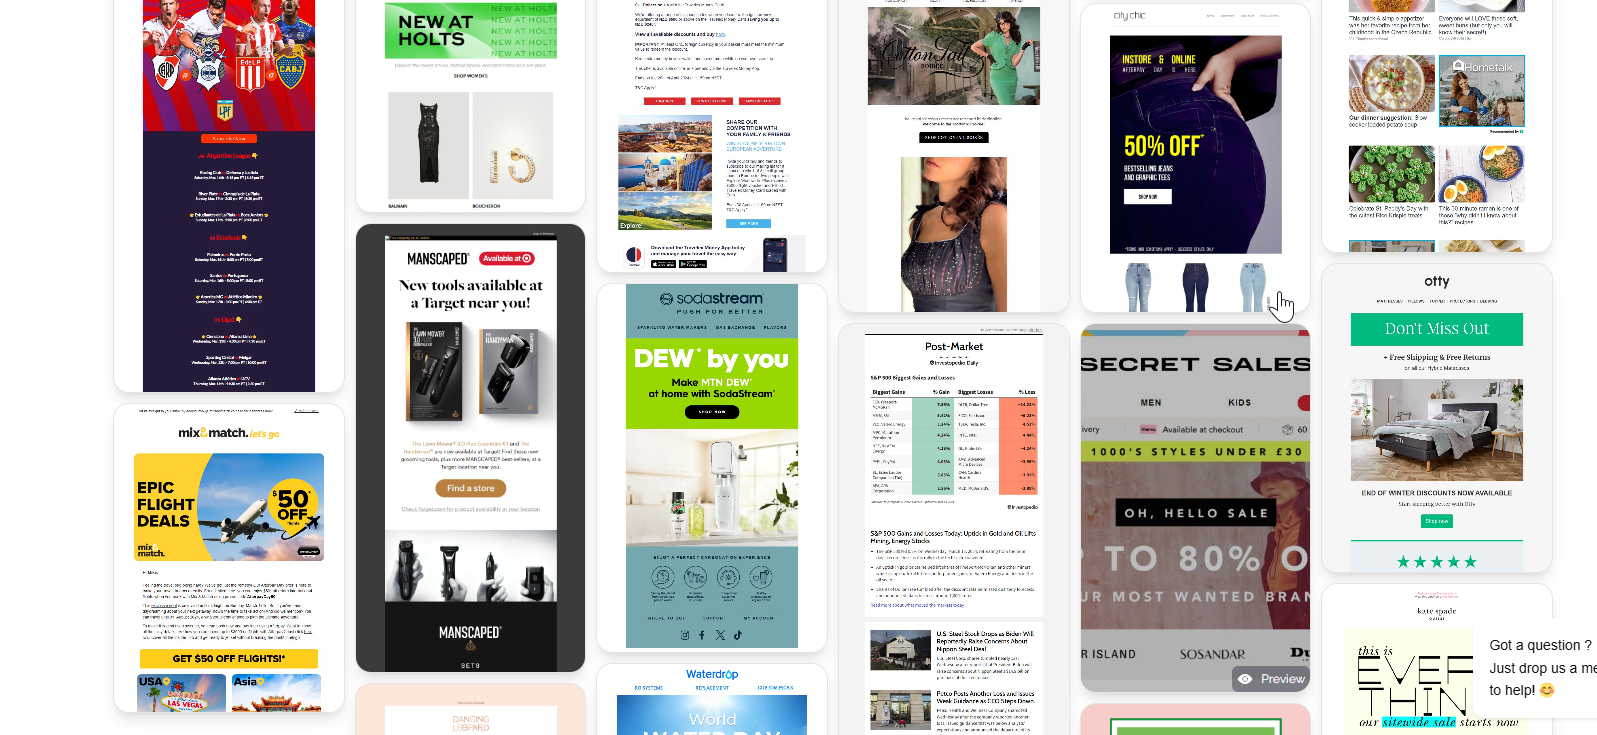
Browse MailGlider to see how top brands design and structure their email programs — a useful reference when deciding which campaign types to prioritize based on what historically drives the best results.