In Yesterday’s post, I mentioned that one of the most important rules we adhere to as Technical Analysts is to make sure that we know and follow the Primary Trend. My own worst trading performance was in 2009 when I was convinced the market would fall but the Primary Trend was going higher. If only I’d done the CMT before then!
We’ve all looked at ATRs in terms of stop losses. Ie. When price falls by more than 1 ATR (the normal daily volatility) we conclude that the trend has changed—since the move is not greater than the typical volatility—and we exit the trade.
In the early 90’s, Michael Gur wrote a book called “The Symmetry Wave Trading Method” and the general crux was constructing “swings” using multiple ATRs as the trigger for a change in direction.
A Swing chart/overlay is an awesome way to determine trend. There are only two options (up or down). There are many calculations that we can use for swings to determine the direction. From points or percent retraced through to bar relationships as introduced by WD Gann. No matter how they are calculated, we can use them as our guide to only trade with the Primary Trend.
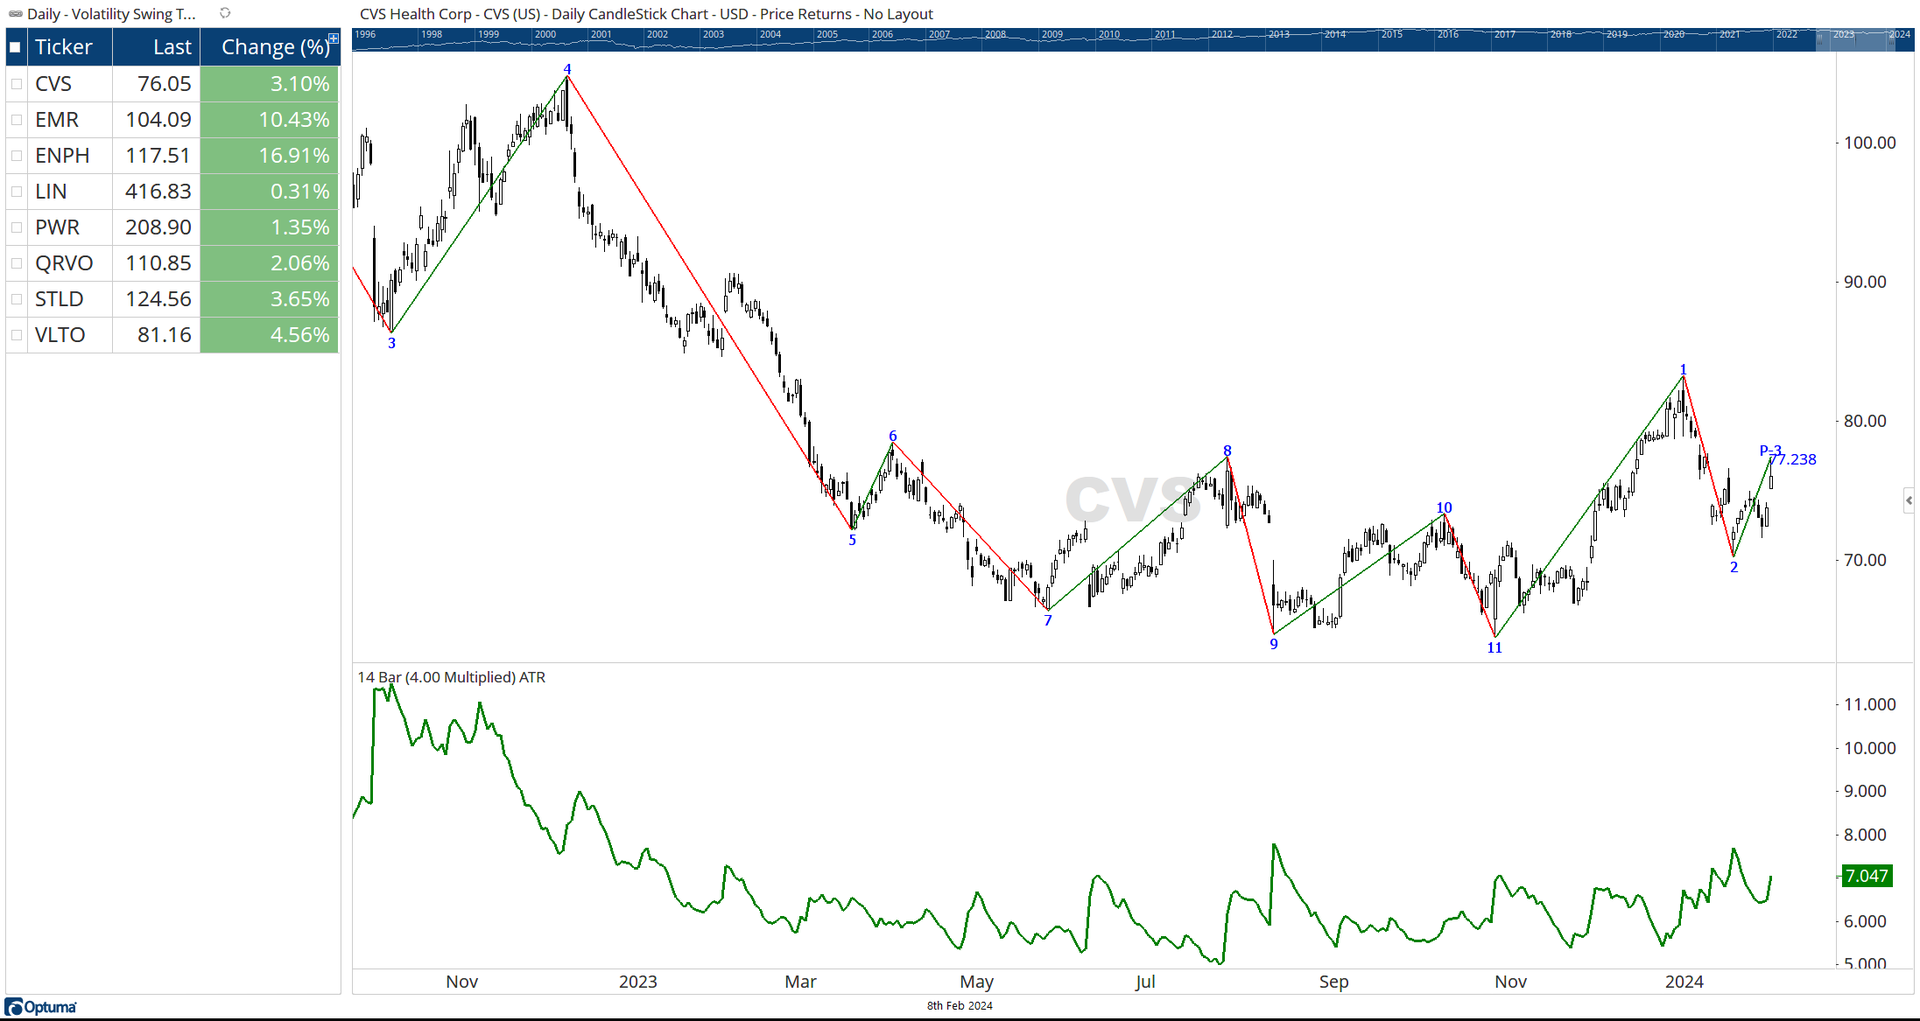
In Chart 1, I’ve scanned the S&P500 for any names that have turned to an uptrend in the last day (Feb 8 data) using a 4-ATR Volatility Swing. The list is short with only a few names—which make it easy for us to examine them. Using Feb 7’s data (when I wrote this) CVS showed up and it is really interesting.
If you look at the bottom of the chart where there is an “11” label, you will see that a new regime of upward trends has started. The “11” tells us that there had been 11 successive lower swing lows without a higher swing high. The “1” on the next swing higher (after 11) tells us that we made a new swing high and have started a new count in the opposite direction.
In this environment, we just got a signal that Swing 2 is set (because the market retraced enough from 2) and we have a Potential wave 3.
Right now, you may be thinking “CVS didn’t just turn. The swing bottom was at 2!” That’s a confusing part of how these swings are drawn. It is not until price retraced by 4 ATRs that we add that last swing at all. Since Jan 25, the average 4 ATR value was 6.5, and given the low at “2” was around $70, CVS had to climb above $76.50 before we could add the swing. That happened on Feb 7th.
While the aggressive traders may take this signal right now with a stop at “2”, the more conservative approach would be to wait for CVS to post a newer high above “1” ($83.25). Either way, Swings provide an interesting way to determine the trend in the market – something we all need to be able to do.