1/ Risk On Indicator - India |
2/ High Beta Stocks Taking a Breather |
3/ Consumer Staples Taking the Lead |
|
|
Investopedia is partnering with CMT Association on this newsletter. The contents of this newsletter are for informational and educational purposes only, however, and do not constitute investing advice. The guest authors, which may sell research to investors, and may trade or hold positions in securities mentioned herein do not represent the views of CMT Association or Investopedia. Please consult a financial advisor for investment recommendations and services. |
|
|
Risk On Indicator - India |
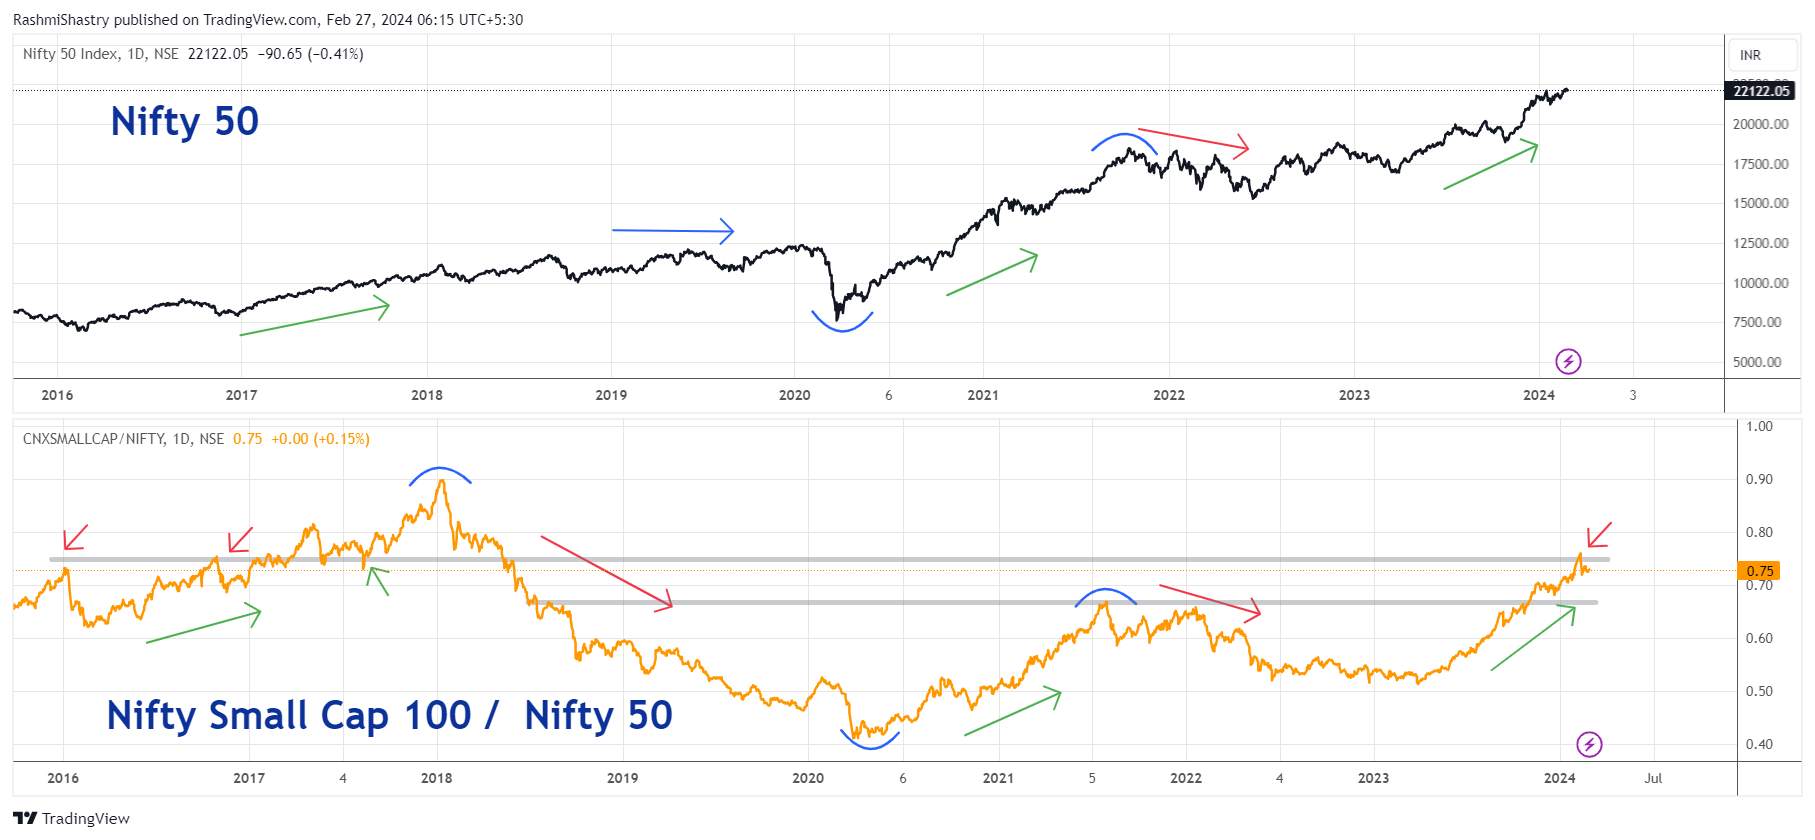
Let’s take a look at some of the risk-on-risk-off indicators to be tracked in a market that seems to be giving some mixed signals. From the Indian market context, the most prominent risk-on indicator I track is the ratio between the Small Cap 100 and the Nifty 50. The market gains strength and participation when the small cap index contributes to the move. When this ratio (bottom panel) is inching higher, the small caps are outperforming the large-caps and vice versa. In the chart we can see Nifty 50 in the top panel and the ratio in the bottom panel. As can be observed by the annotations, a lack of outperformance by the small caps is often followed by a sideways move or correction in Nifty 50. In fact, the 2020 correction was preceded by a massive underperformance in the small caps whereby the bulk of the heavy lifting was being done by the large caps, resulting in a mere 1500 points move in over two years! But as can be seen in the chart, even ratio charts have support and resistance zones that can be tracked. Although the ratio broke out of a five-year base, it is currently stuck under overhead supply. If, however, we do see a breakout coming through, the market will race away higher in the months ahead. But a consolidation at these levels cannot be ruled out at present. |
|
|
High Beta Stocks Taking a Breather |
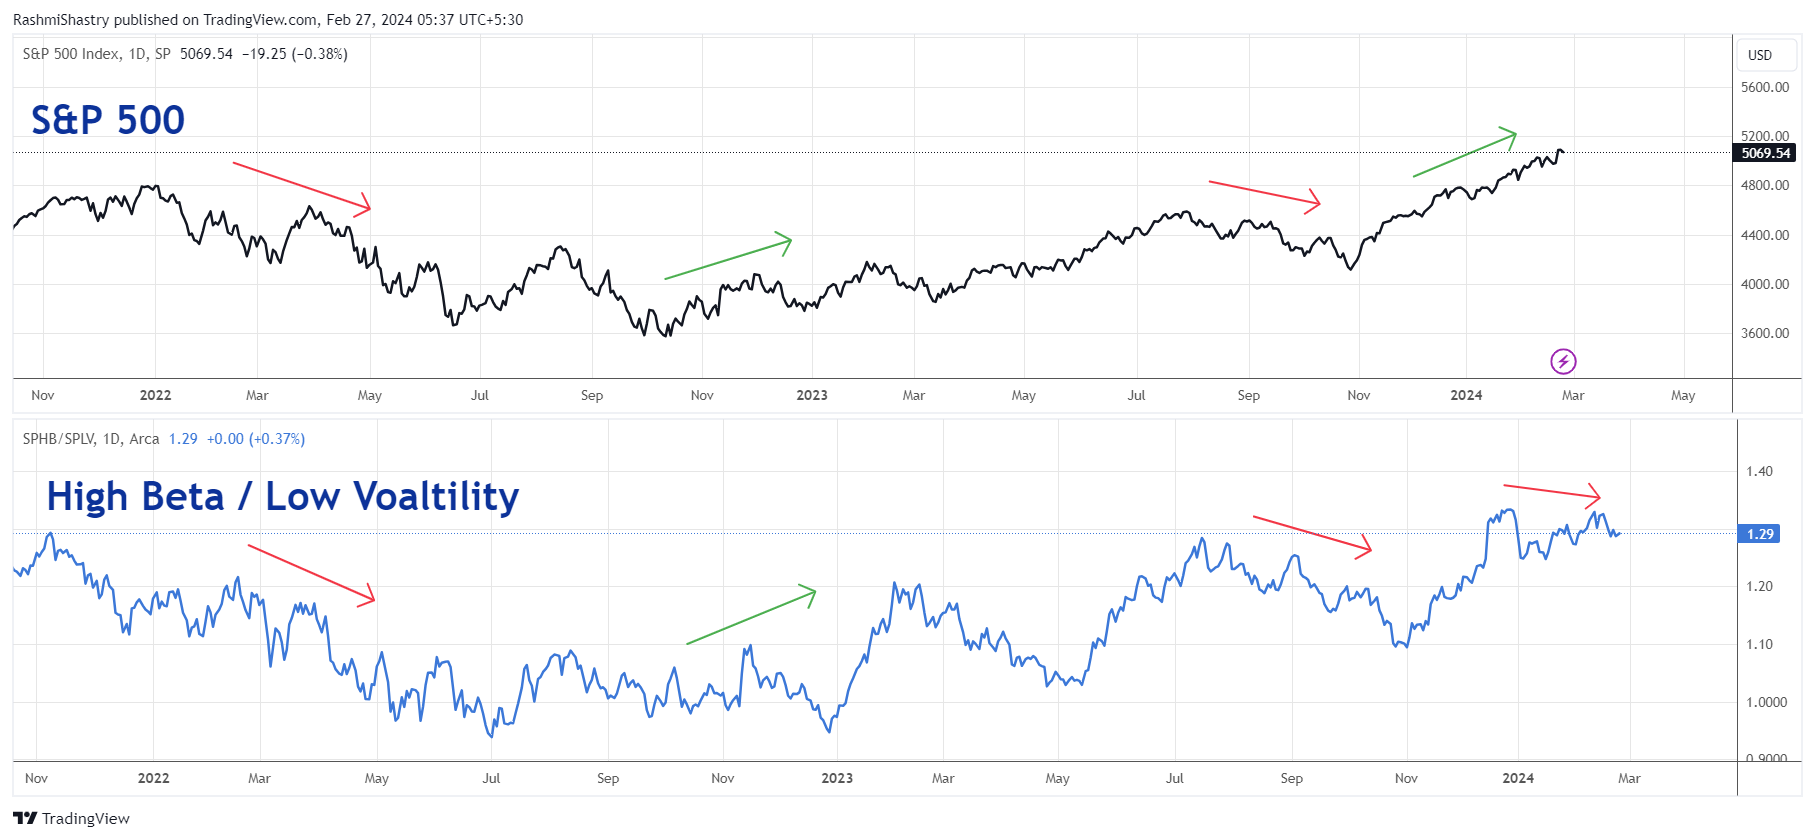
High beta vs. Low volatility is another favorite risk metric that gives me an idea of market drivers. And as you will notice the S&P 500 and the High Beta(SPHB) / Low Volatility (SPLV) move in the same direction for the most part. So what information does that leave us with? It is when the top panel and the bottom panel move in different directions, that we get some new insights! In the most recent move leading up to this month, we can see that the high beta stocks are tapering off (since the ratio is moving lower) and the low volatility stocks are outperforming. But this is happening when the S&P 500 is rallying higher. This inverse relationship typically doesn’t last too long, and one of the two corrects itself to follow the same direction. This divergence in the relationship tells me that I need to be cautious of my outlook. |
|
|
Consumer Staples Taking the Lead |
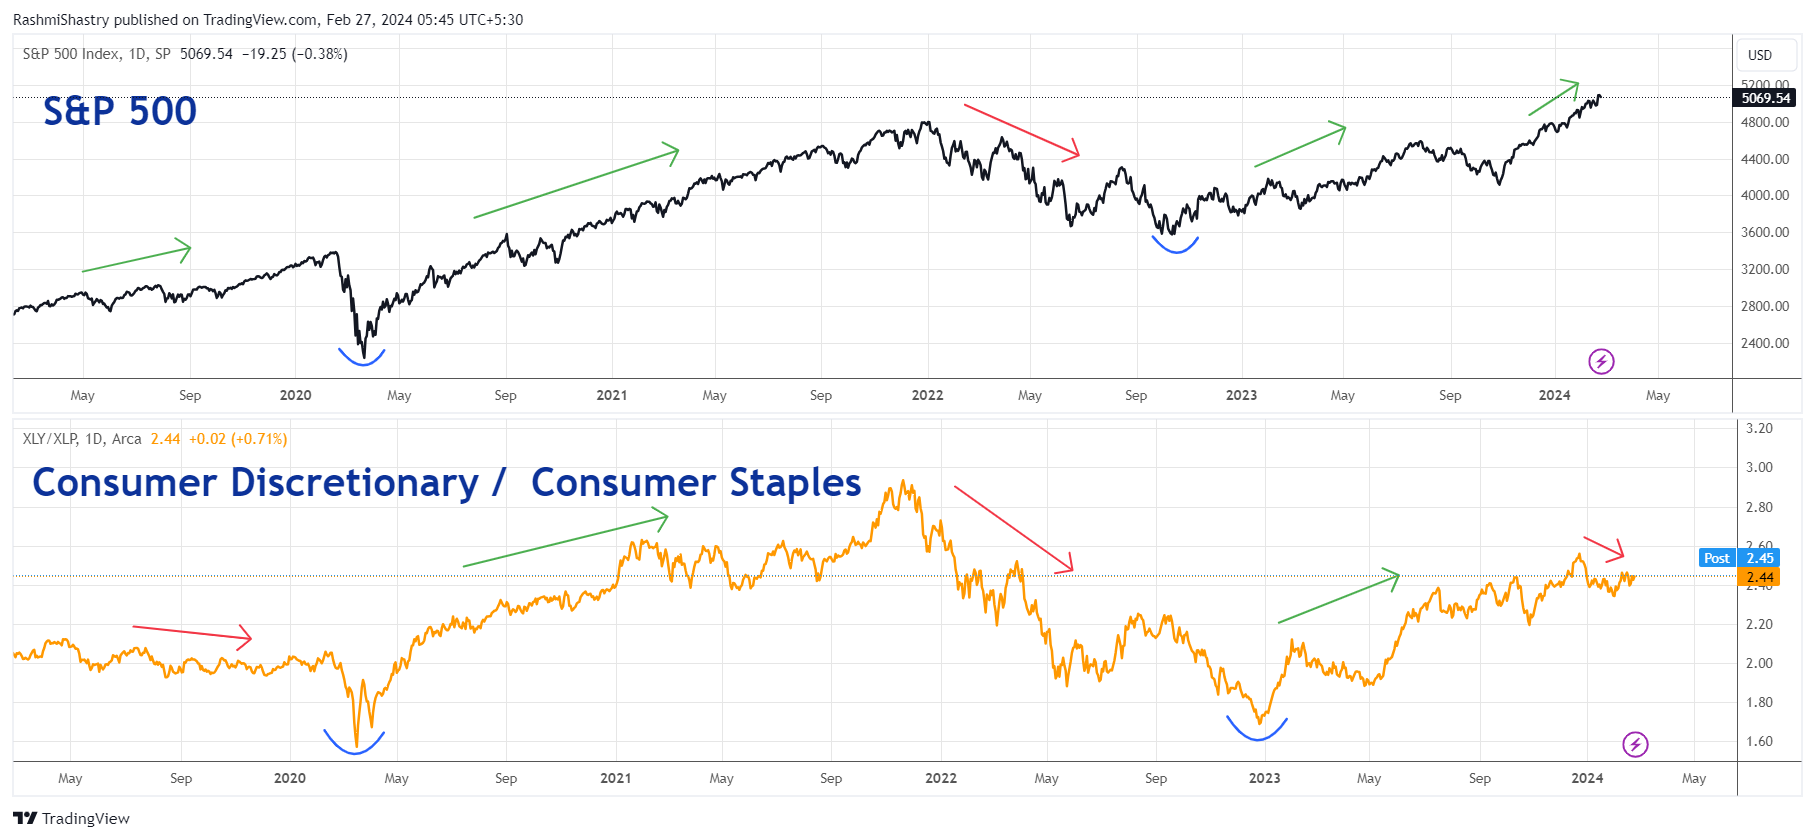
The relationship between Consumer Discretionary and Consumer Staples, though belonging to Consumption, gives us information that helps us identify the market cycle as well as risk appetite. Are market participants taking on more risk, or standing by on the side? Like the earlier chart, this ratio too moves largely in the same direction as the S&P 500. It is when this direction doesn’t match, that draws attention. Consumer Staples are non-negotiable products that the consumer will buy regardless of the market cycle, inflation, etc. Discretionary products are what the consumers will indulge in when there is the option to consume them- discretionary income. So this ratio between Discretionary and Staples is very simple. The market is risk-on when the ratio is moving higher and is risk-off when the market is moving lower. Most importantly the signal to look out for is the divergence of signal between the ratio and the S&P 500. Which is where we are at present. That makes it two risk metrics where the ratios are making lower highs and the index is making higher highs. |
|
|
Rashmi Bhatnagar, CMT is a Market Technician at All Star Charts India. Previously, she was an Equity Research Analyst at Enrich Investments in Hyderabad, India. She received her charter in February 2020 and has been a part of the financial markets since 2016. |
|
|
You are receiving this newsletter because you subscribed to the Chart Advisor newsletter. If you wish to unsubscribe, please click here. Dotdash Meredith 225 Liberty St, 4th Floor, New York, NY 10281
© 2024 All Rights Reserved. Privacy Policy | Terms of Service |
|
|
|