Investopedia is partnering with CMT Association on this newsletter. The contents of this newsletter are for informational and educational purposes only, however, and do not constitute investing advice. The guest authors, which may sell research to investors, and may trade or hold positions in securities mentioned herein do not represent the views of CMT Association or Investopedia. Please consult a financial advisor for investment recommendations and services. |
|
|
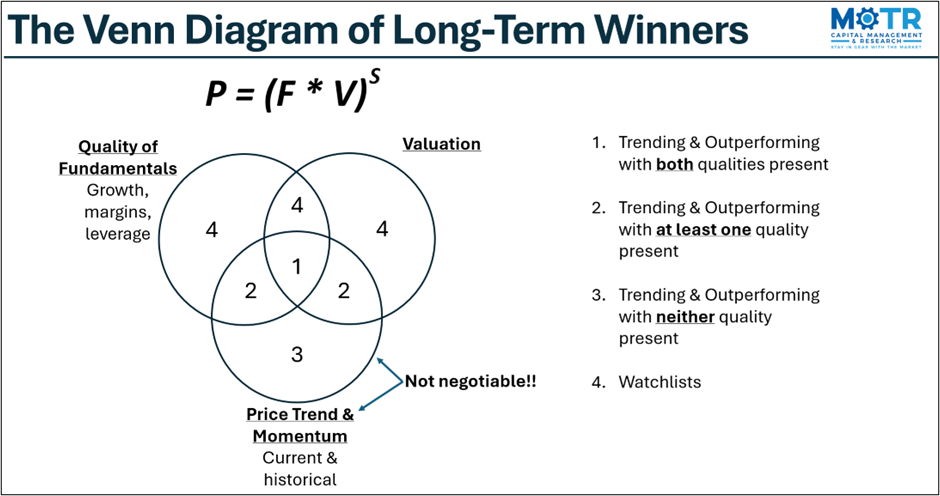
In yesterday’s missive, using the simple formula P=(F*V)S, I highlighted the inviolable link between long-term trends in both stock prices and fundamentals, and how all good things that happen to price begin with superior fundamentals, valuation expansion, and optimistic sentiment. “Multi-baggers” happen when price benefits from simultaneous improvements in all three of these inputs. However, I also drew a fine line yesterday between fundamentals and opinions of fundamentals, and how, in my view, the only opinion that matters is that of the market, or price trend itself. Why is that? Because no matter what one thinks about a company’s future growth prospects and present valuation, that opinion will never be monetized favorably until the market agrees with it, via a strong price trend and relative outperformance. In accordance with this philosophy then, investors should populate their portfolios with stocks that meet as many of these “muti-bagger” criteria as possible. The Venn diagram of long-term winners featured below provides a simple framework for thinking about this objective. Ideally, a portfolio will be full of “1s”, a smattering of “2s”, and perhaps afew “3s”. Most importantly however, “4s” should be avoided at all costs. |
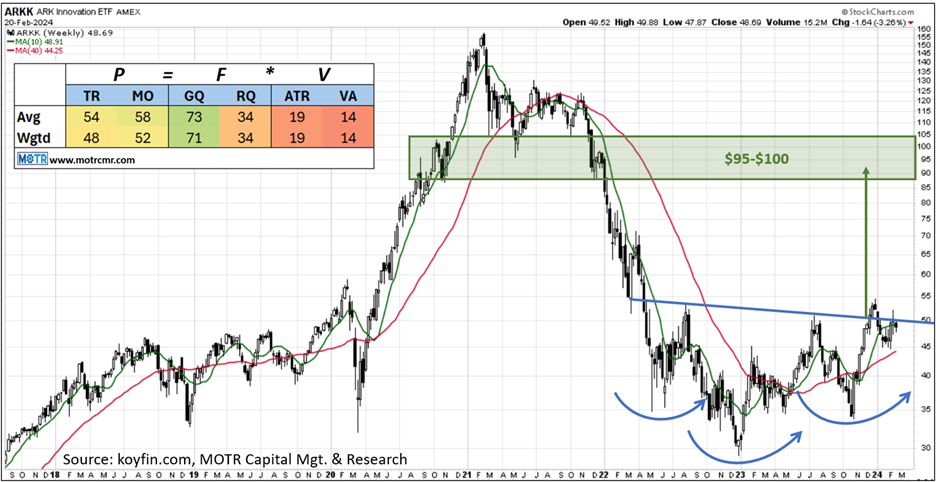
Some investors gain the greatest comfort from being contrarian, buying stocks when they are outside of the “Price Trend & Momentum” circle (i.e., “4s”). Of course, this might work out from time to time, but one of the few guarantees in this business is that no stock will ever be a multi-bagger without first making its way back into this circle. Let’s therefore call it the “Winner’s Circle”. One can lean on this concept to assess the future prospects of an ETF, for instance. By mapping the holdings of an ETF to this Venn diagram of long-term winners, we can qualify whether or not the portfolio is positioned for future success. By way of example, the ARK Innovation ETF (ARKK) chart pattern (below) would likely be identified by most technicians as a complex head & shoulders bottom, and I would agree. Another rotation higher, with a close above $55 would open the door to a run to the pattern’s upside target in the $95-$100 area (green box), which also overlaps with the Q1’21 lows, as well as the zone between a 50% and 62% retracement of the roughly -80% decline from 2022-2023. |
Like the S&P itself, this ETF can only achieve that objective if the stocks within it are up for the challenge. In the” P=F*V” framework (inset in chart above), we can see that the average (Avg) trend score (TR) and momentum score (MO) hover just above average at 54 and 58, respectively. In terms of fundamentals (F), using data from Koyfin.com, we can simply calculate the growth quality (GQ) and returns quality (RQ) of each stock compared to the rest of the market. Befitting the manager’s style, we can see that the average stock’s GQ score is far greater than its current RQ score (73 & 34, respectively). This suggests that the manager’s expectation is that these stocks, on average, will grow themselves into profitability, a characteristic mindset of those investors trafficking in the disruptive technology space. Finally, we have valuation (V). Here, we can see that the average stock in the portfolio scores rather poorly from a valuation (VA) perspective relative to the rest of the market (14). This too is almost par for the course for hyper growth investors, banking that stocks that look expensive today are likely to look cheap in hindsight once the expected growth and profitability come through. In history, Amazon was a good example of this, where famed value investor Bill Miller was ridiculed and chastised for owning Amazon in the Legg Mason Value Fund. He pushed back saying it was inexpensive based on future growth, and boy was he ever proven right! Just as the price-earnings ratio (PE) is what you pay for the fundamental prospects of a company, I have always felt that volatility is the price we pay for the trend we choose. In “GARP” investing (growth at a reasonable price), the goal is to buy as much future growth and quality returns on capital per unit of valuation as possible. Similarly, in trend following, we want to own the best performing trends per unit of volatility. In this case here, we can see that the overall trend score for this ETF, at 54, is not as of yet compensating the investor for the very poor volatility (average true range, or ATR) score. On average then, it would seem that the ETF’s holdings have some heavy lifting to do if the ARKK is going to float back to the water’s surface. However, just as we were reminded this year that the S&P can be propelled higher by a handful of stocks while the rest of its constituents treaded water, is such an outcome possible for the ARKK ETF? Anything is possible, but as the inset shows, the “cap-weighted” scores (Wgtd) are not much better. So, while entering a long position above $55, or even now before the breakout with a $45 stop, looks like an attractive setup on the surface, don’t lose sight of the fact that the ETF is just a portfolio of stocks. Barring a mini-MAG7 scenario, it would seem prudent to keep positions on the smaller side until the trend (TR) and momentum (MO) scores being to improve on average. |
|
|
David Lundgren, CMT, CFA has more than three decades of investment industry experience, with a focus on technical analysis strategies, particularly momentum and trend following. He launched and Co-Hosts “Fill the Gap”, CMT Association’s official podcast and is a member of CMT Association’s board of directors. He has started several research and investment firms, including hedge fund Lyceum Capital, Breakaway Research, and most recently MOTR Capital Management & Research, Inc. |
|
|
You are receiving this newsletter because you subscribed to the Chart Advisor newsletter. If you wish to unsubscribe, please click here. Dotdash Meredith 225 Liberty St, 4th Floor, New York, NY 10281
© 2024 All Rights Reserved. Privacy Policy | Terms of Service |
|
|
|