2/ Comparing Moving Averages |
|
|
Investopedia is partnering with CMT Association on this newsletter. The contents of this newsletter are for informational and educational purposes only, however, and do not constitute investing advice. The guest authors, which may sell research to investors, and may trade or hold positions in securities mentioned herein do not represent the views of CMT Association or Investopedia. Please consult a financial advisor for investment recommendations and services. |
|
|
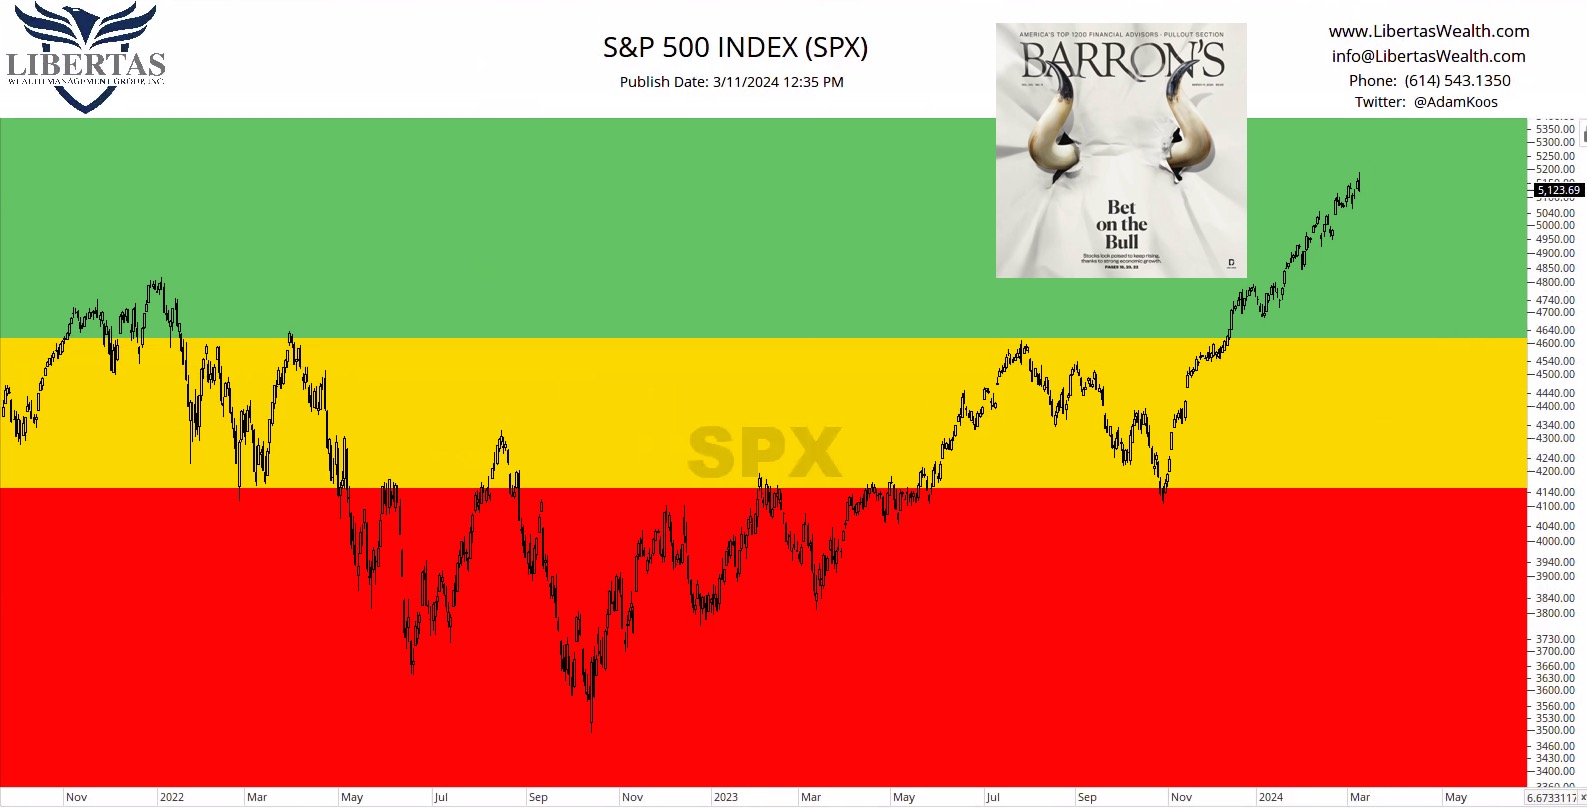
After spending more than two years in the danger and caution zones, our “Inverse Traffic Light” is signaling “all green” for the market at this juncture. Zones are created using support and resistance levels going back as far as early 2022. While there is no arguing with this uptrend, it would make complete sense if the market digested some of the recent gains, pulling back to the 2021 highs, or even the spring ’22 and summer ’23 highs (marked by the top of the caution zone / bottom of the green zone). However, while seasonality suggests tough times lie ahead over the course of the next several weeks, and while Barron’s magazine has printed a cover that could mark a short-term top in stocks (as a contrarian indicator), sideways digestion is also a possibility we need to keep in mind, as well. |
|
|
Financial market research from professionals at the forefront of technical analysis innovation. |
|
|
Comparing Moving Averages |
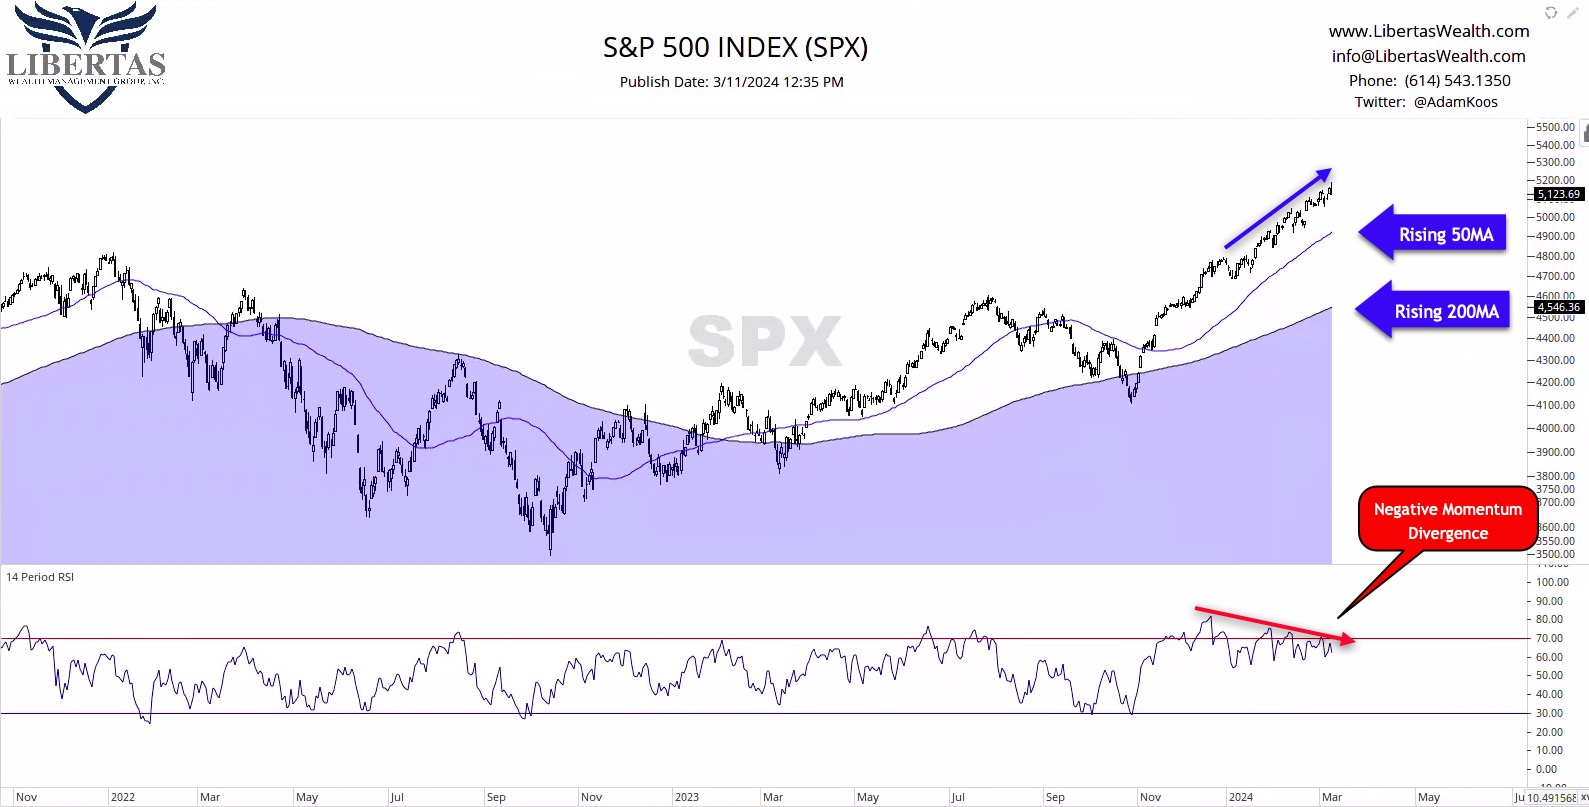
Looking at the S&P500 through a different lens, we can clearly see a rising 50MA and 200MA. Moving averages help to smooth out the choppiness in charts, and make it easier to determine what the current trend is (all depending on your timeframe). One thing to keep in mind is that bottom pane in RSI, which is a momentum indicator. Whenever we see price rise (in the upper pane) and momentum falling, this is what we call a “negative momentum divergence.” It’s not a for-sure-thing, but price has a tendency to follow momentum, and since we’re seeing momentum falling (and especially since it’s topping out below 70), it’s another piece of evidence that stocks could be in for a pullback, or a “stall” at the bare mimimum. |
|
|
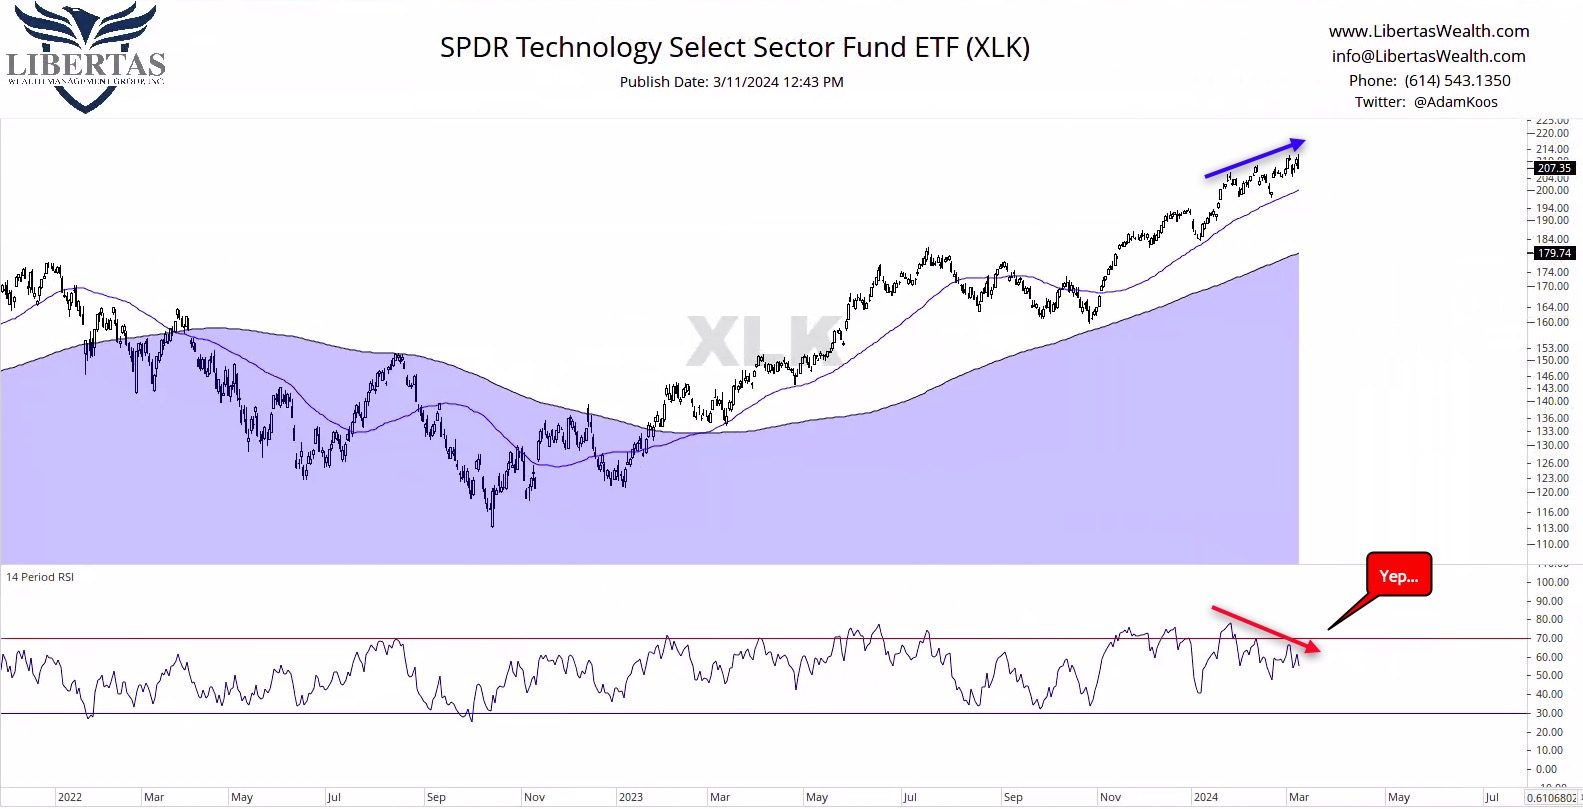
Since technology and A.I. have been at the focus of roughly every news program, commercial, and advertisement in your social media apps, I thought it would be interesting to check and see if we were seeing a similar negative divergence in momentum… and yep, like the old Prego commercials used to say, “It’s in there.” Granted, like the overall market, technology is unequivocally in an uptrend. The big question is, like most stocks, “Are we in for a pause, given how well things have gone this past few months?” Only time will tell, but if one thing is for certain, it rarely pays to be a “trend predictor.” Rather, I find that “trend following” is much easier on the emotions. Predicting (i.e., “guessing”) is almost never a great strategy! |
| |
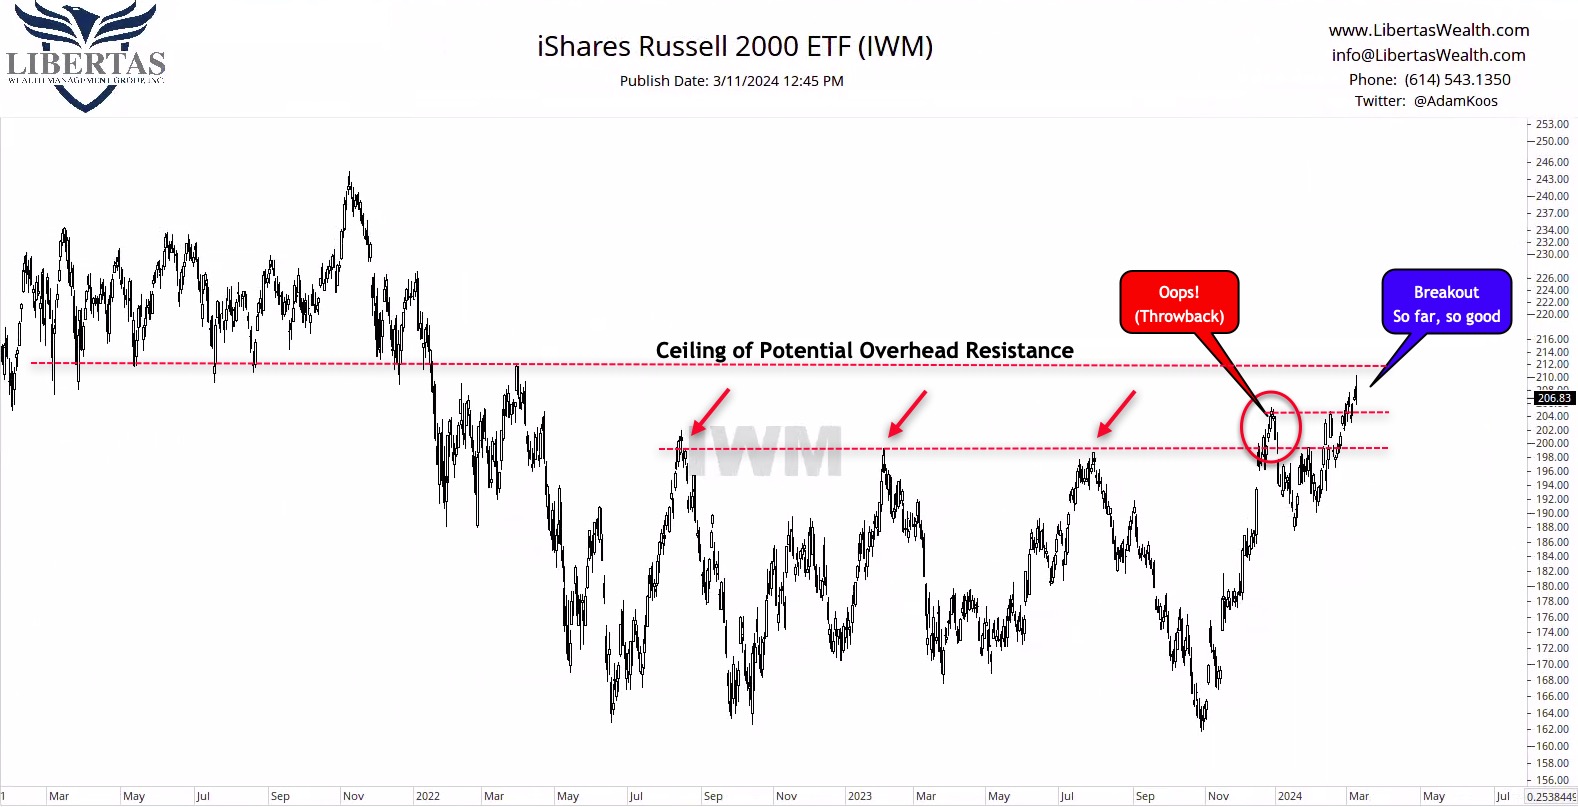
Lastly, I thought I’d peek under the Small-Cap hood, see what’s going on with these smaller companies, and what we discover here is good news! Unlike its large and mega-cap big brothers, small-caps have been struggling on a relative basis, ever since the bull market recovery began. That is… until recently. What you’re seeing in the chart above is first, a breakout that turned into a “fake out” (or more technically defined as a “throw back” below the line of overhead resistance marked by the red arrows). However, after just a few weeks, and more importantly, a major higher-low, small-caps broke out above that former ceiling of resistance, as well as above the previous breakout high, so as the call-out above reads “so far, so good!” That being said, there is another ceiling of potential overhead resistance as marked by the spring ’22 highs, and a peppering of former support going all the way back to 2021, so it wouldn’t surprise me to see some choppiness and digestion before small-caps break out any further. |
|
|
Adam Koós, CFP®, CMT, CEPA is a Certified Financial PlannerTM, a Chartered Market Technicians (CMT), as well as a Certified Financial Technician (CFTe®) via the International Federation of Technical Analysts (IFTA). He’s been named by Columbus Business First as one of their 20 People to Know in Finance, is a recipient of the Forty Under 40 award, was ranked by Investopedia as one of the Top-100 Most Influential Financial Advisers in the U.S., and is a proud winner of the coveted Better Business Bureau “Torch Award” for Ethics and Trust. Adam serves his clients as the president, portfolio manager, and senior financial adviser at Libertas Wealth Management Group, Inc., a Fee-Only Registered Investment Advisory (RIA) firm, located in Columbus, Ohio. To reach out to Adam Koós email adam@libertaswealth.com. |
|
|
You are receiving this newsletter because you subscribed to the Chart Advisor newsletter. If you wish to unsubscribe, please click here. Dotdash Meredith 225 Liberty St, 4th Floor, New York, NY 10281
© 2024 All Rights Reserved. Privacy Policy | Terms of Service |
|
|
|