1/ US Markets on the Roll; Previous Week’s High Not Yet Taken Out |
2/ Australia is Breaking Out |
3/ Classical Retest of Breakout Level by this Country ETF |
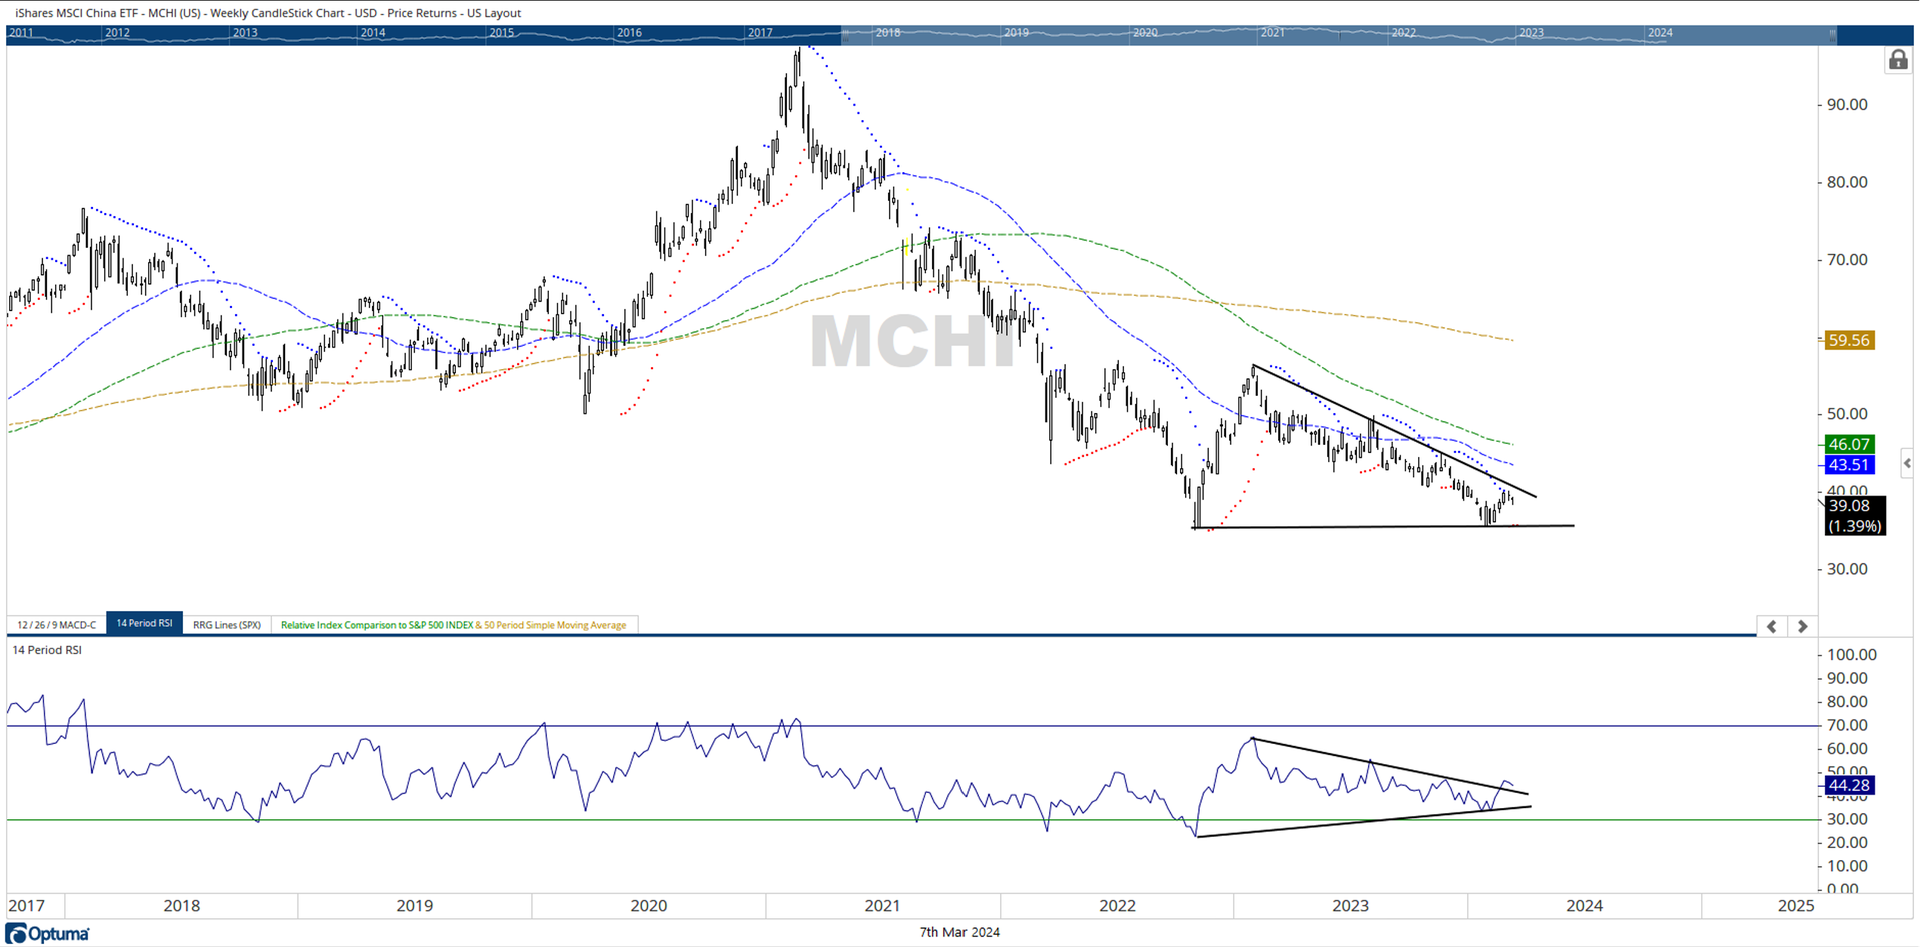
4/ Is China looking at a Technical Pullback? |
|
|
Investopedia is partnering with CMT Association on this newsletter. The contents of this newsletter are for informational and educational purposes only, however, and do not constitute investing advice. The guest authors, which may sell research to investors, and may trade or hold positions in securities mentioned herein do not represent the views of CMT Association or Investopedia. Please consult a financial advisor for investment recommendations and services. |
|
|
US Markets on the Roll; Previous Week’s High Not Yet Taken Out |
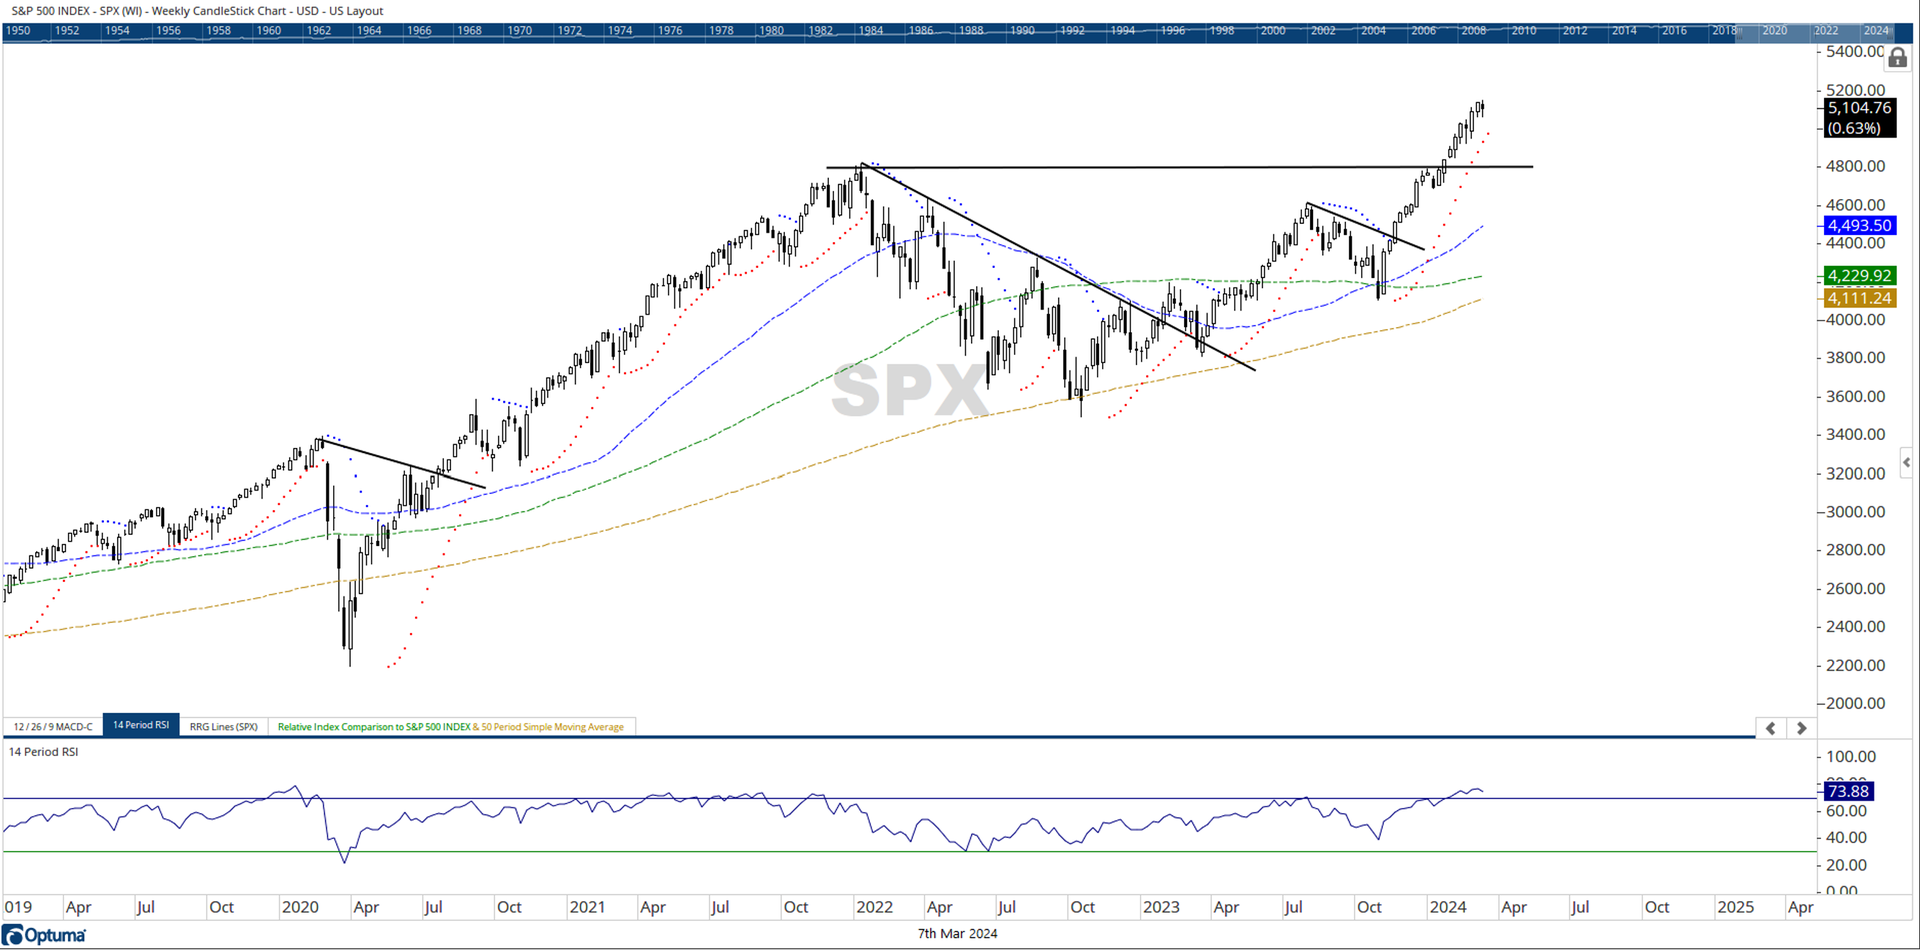
The US markets are on a roll. On Wednesday, the broad market index S&P closed higher by 26.11 points at 5104.76. However, that being said, there are possibilities that the Index may take a short breather. It should be categorically noted that there are no signs of whatsoever nature that would suggest any downside. However, from a classical standpoint, the charts do look a bit over-extended. Besides that, the previous week’s high level of 5140 has not been comprehensively taken out, and the Index rules below that point at present. The index has retraced after forming a minor incremental high at 5149. While it remains overbought, which is a sign of strength, it should not surprise us if the markets take a short breather; this warrants a vigil high at current and higher levels. |
|
|
Australia is Breaking Out |
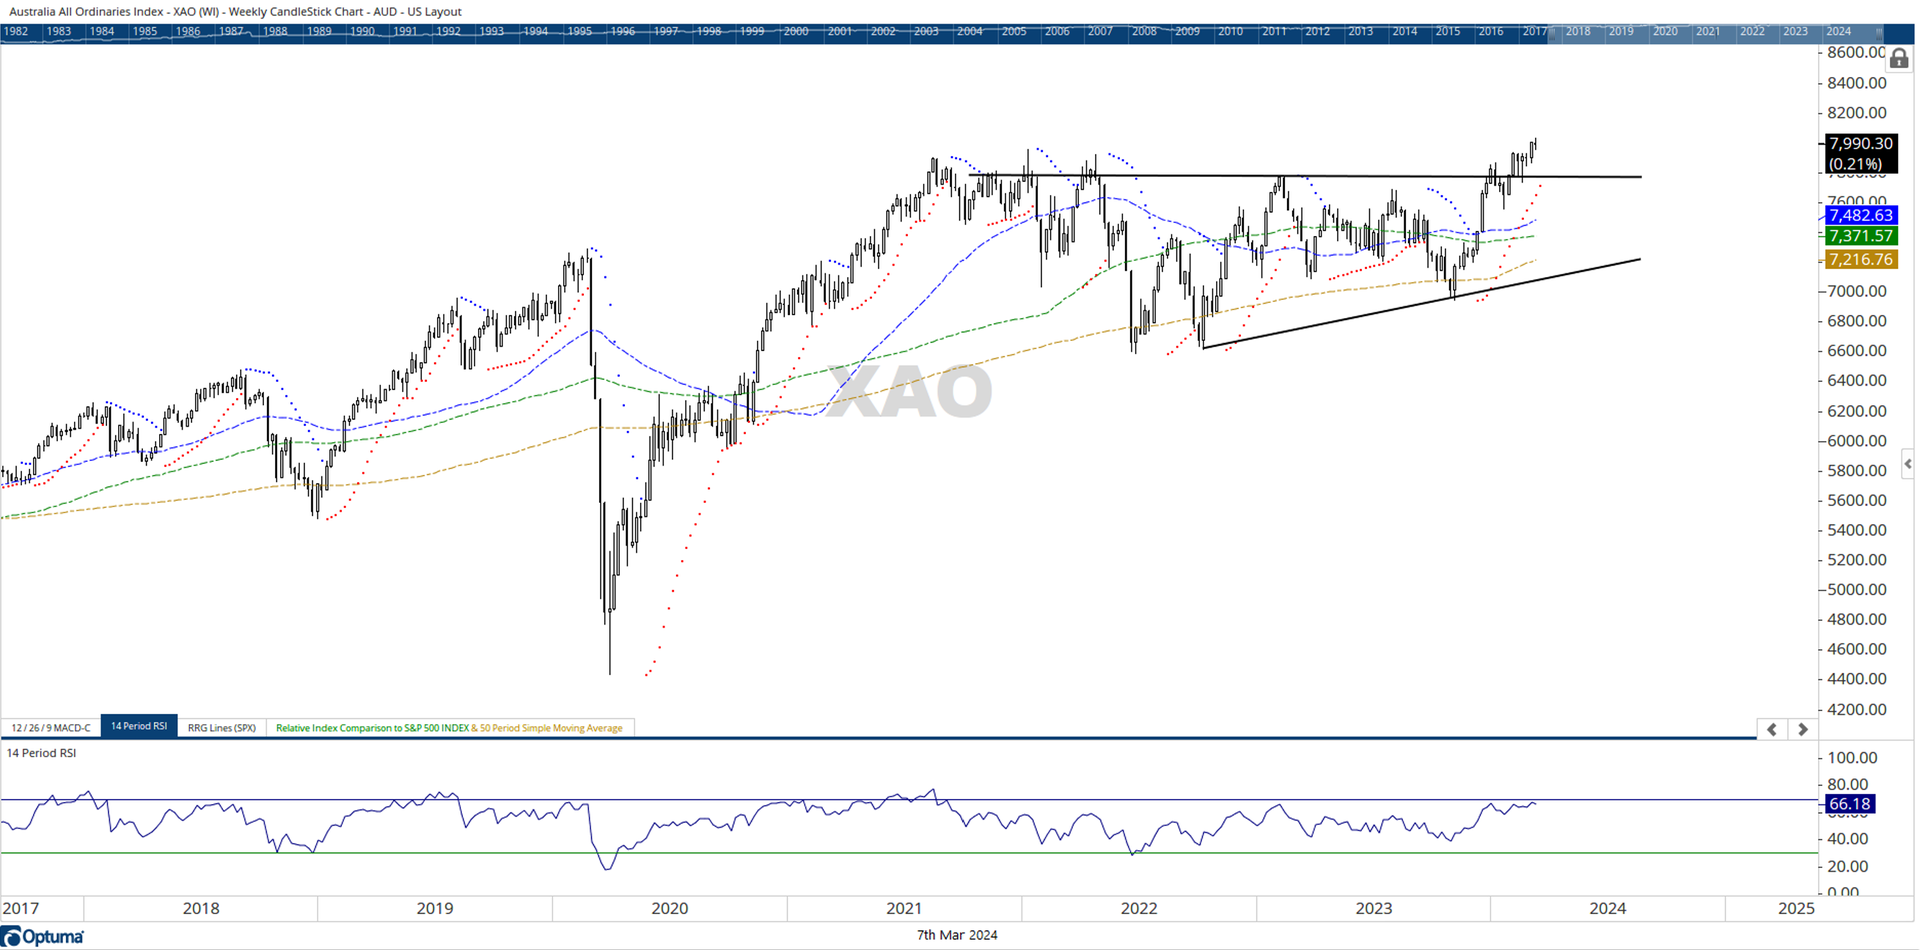
On the other side, we have this country index that has shown a multi-year breakout after doing literally nothing over the past two and a half years. Australia All Ordinaries Index – XAO saw a post-COVID recovery just like other global equity markets. It halted its up move by forming a high of 7902 in August 2021. After that until the beginning of this year, the index remained totally devoid of any trend. It stayed in a broad range taking support at its 200-week MA thrice during this time. At the beginning of February this year, this country's Index attempted a multi-year breakout after a prolonged consolidation. After consolidating just above the breakout level, it has now started to inch higher. Some renewed momentum may be seen here. If this attempted breakout sustains, we may see it moving meaningfully higher from current levels. |
|
|
Classical Retest of Breakout Level by this Country ETF |
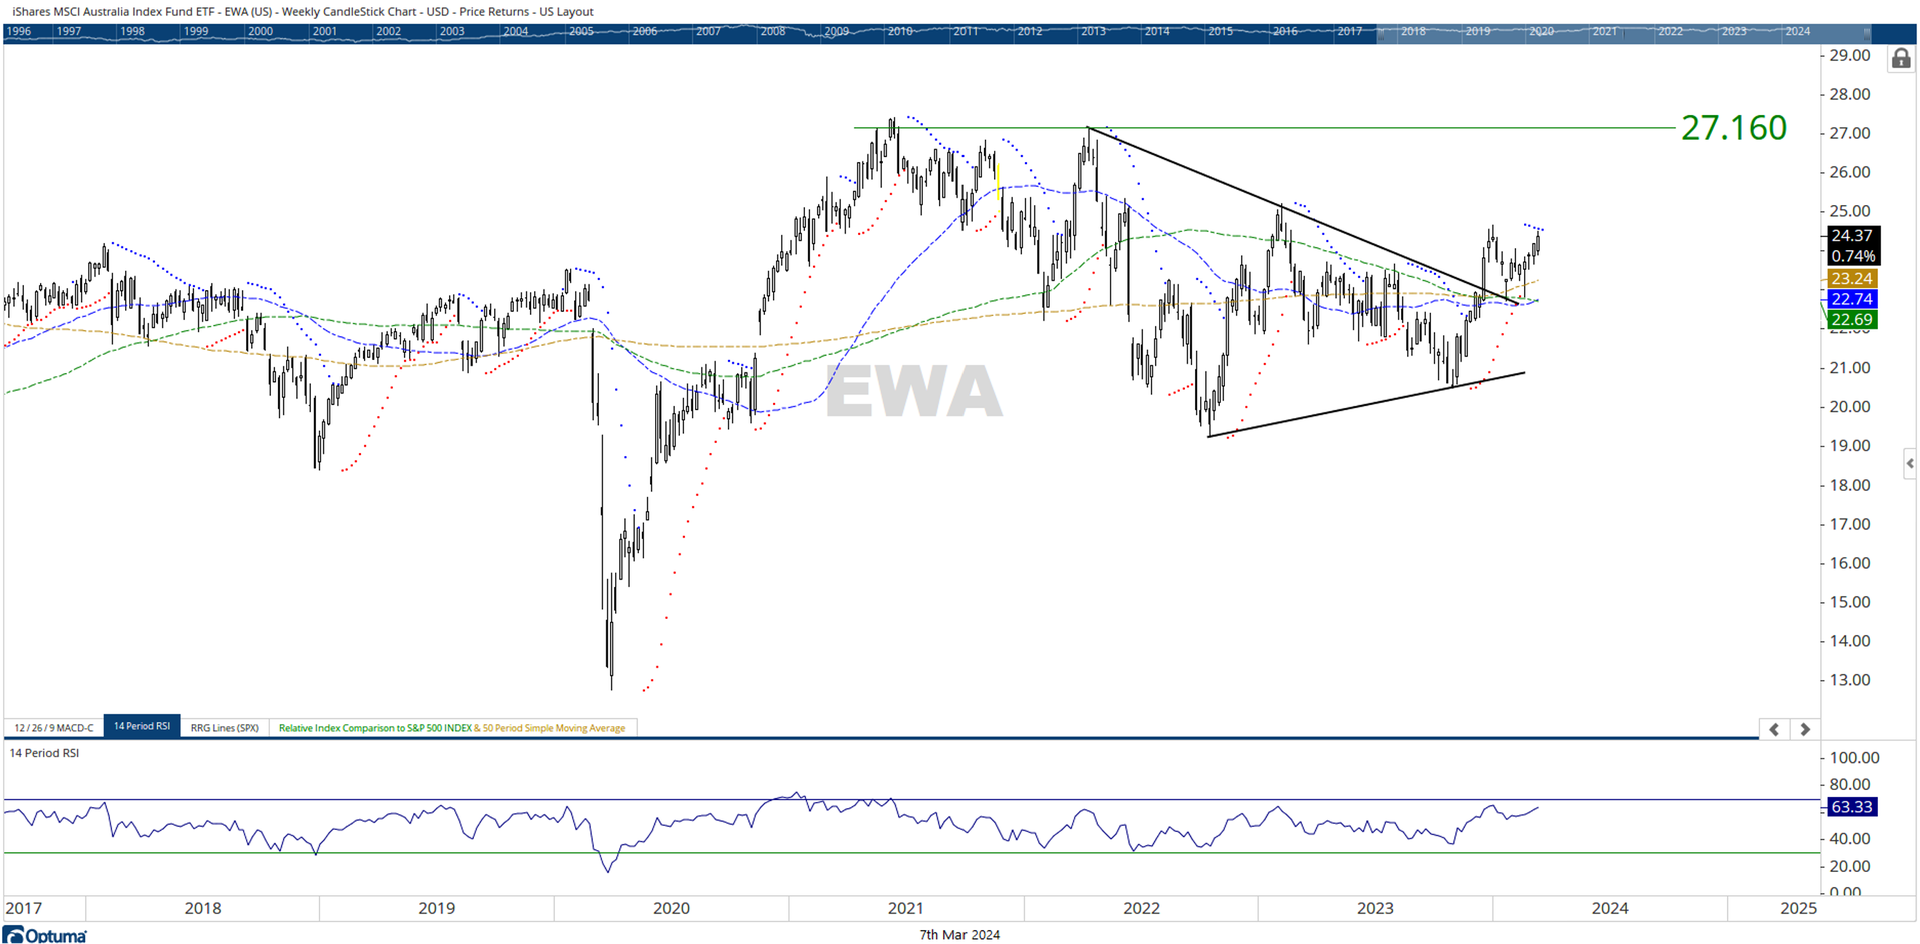
The development of the Australia All Ordinaries Index is reflected in this country-ETF as well. iShares MSCI Australia Index Fund ETF has shown some classical technical setups over the past few weeks. The price action over the past several quarters has led to the formation of a large symmetrical triangle on this ETF. Recently, the price broke out of this otherwise neutral technical formation confirming an entry point for a long position. There was a typical retest and consolidation just above the breakout level as well after which the ETF is showing signs of an up move. A price measurement implication of its formation puts a target level of 27 on this ETF which would mean a potential appreciation of over 11% from the current levels. This remains a long-term portfolio addition; any move below 22 would negate this technical setup. |
|
|
Is China looking at a Technical Pullback? |
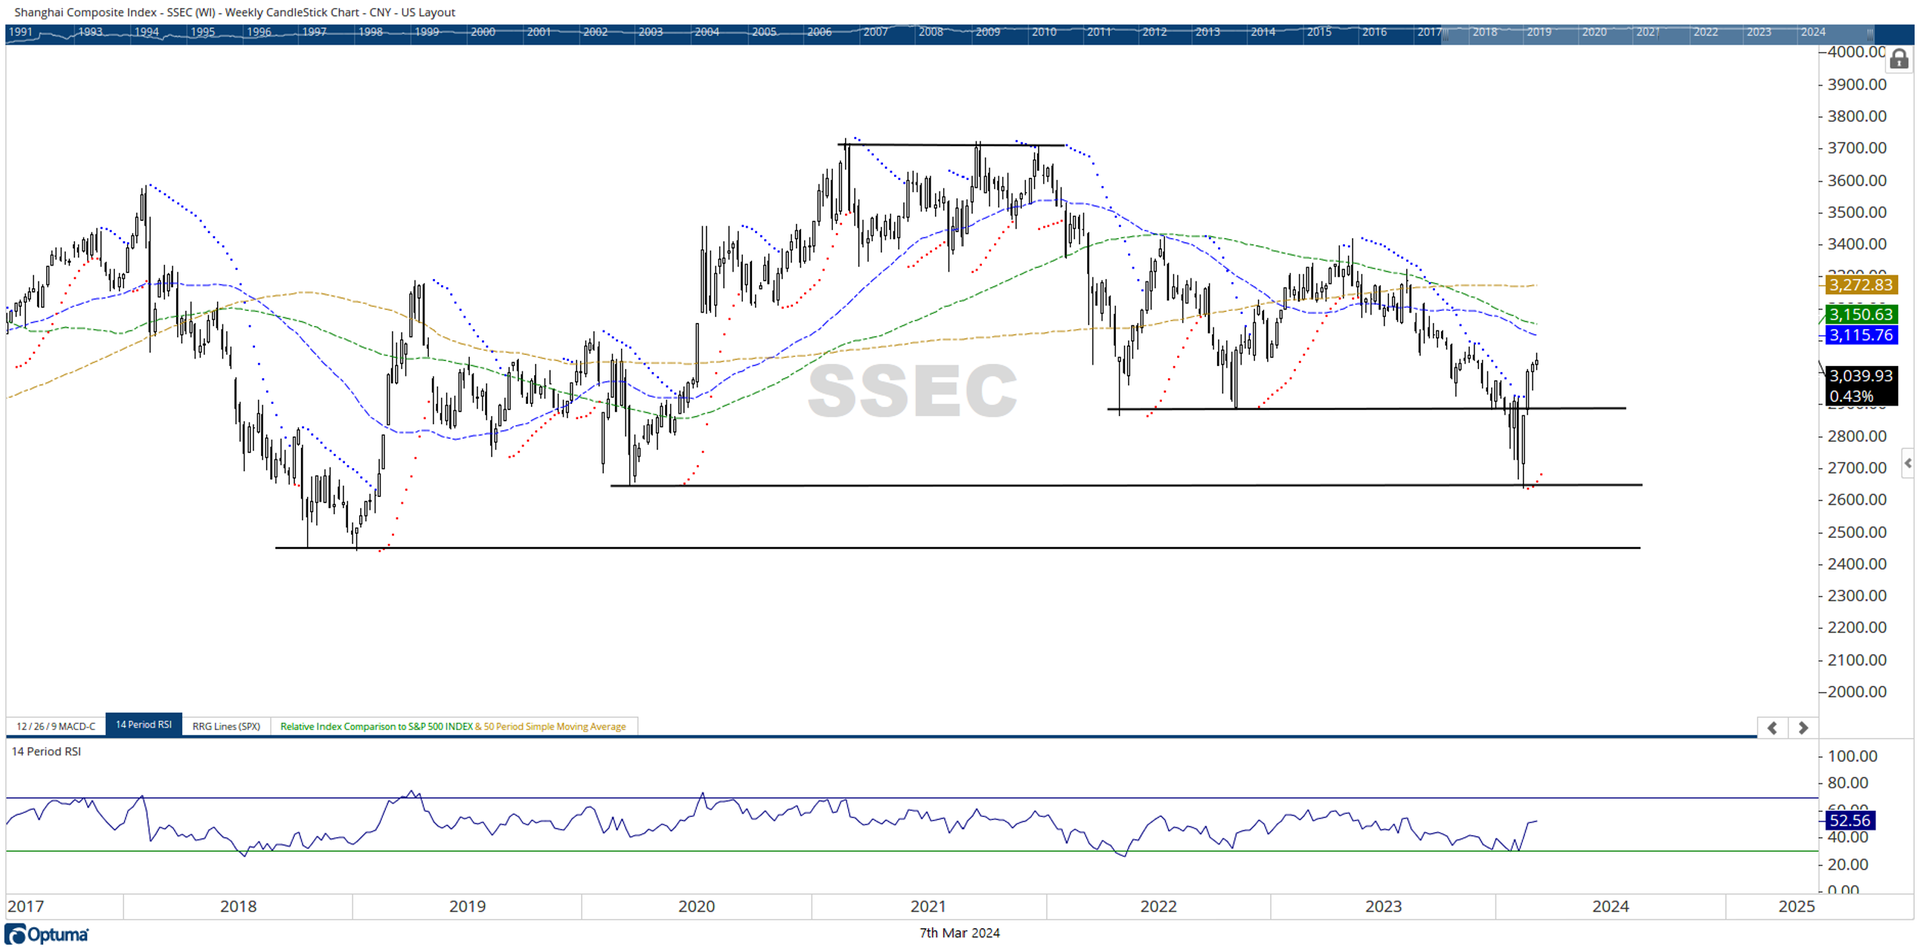
China has been a terrible underperformer for obvious reasons over the past two and a half years. The Shanghai Composite Index failed to break above 3700-3722 levels after several retests and eventually gave up. Recently the Index has attempted a support on a major multi-year pattern support and stares at a potential technical rebound even if a major trend reversal stays illusive. |
The iShares MSCI China ETF shows a potential for a technical rebound. This country's ETF formed its low of 35.40 in November 2022 and after a rebound, it retested this level recently February this year forming a classical double-bottom support. It is seen attempting a form a base at current levels and subsequently attempt a reversal. Importantly, a mild bullish divergence is observed on the RSI. While the price did not make higher bottoms, RSI did. Furthermore, the RSI is seen breaking out of a technical pattern ahead of the price breakout. This makes the possibilities of a technical rebound brighter for this ETF. The most immediate resistance point, therefore a target, can be placed at 43-43.50 levels. |
| |
You are receiving this newsletter because you subscribed to the Chart Advisor newsletter. If you wish to unsubscribe, please click here. Dotdash Meredith 225 Liberty St, 4th Floor, New York, NY 10281
© 2024 All Rights Reserved. Privacy Policy | Terms of Service |
|
|
|