Investopedia is partnering with CMT Association on this newsletter. The contents of this newsletter are for informational and educational purposes only, however, and do not constitute investing advice. The guest authors, which may sell research to investors, and may trade or hold positions in securities mentioned herein do not represent the views of CMT Association or Investopedia. Please consult a financial advisor for investment recommendations and services. |
|
|
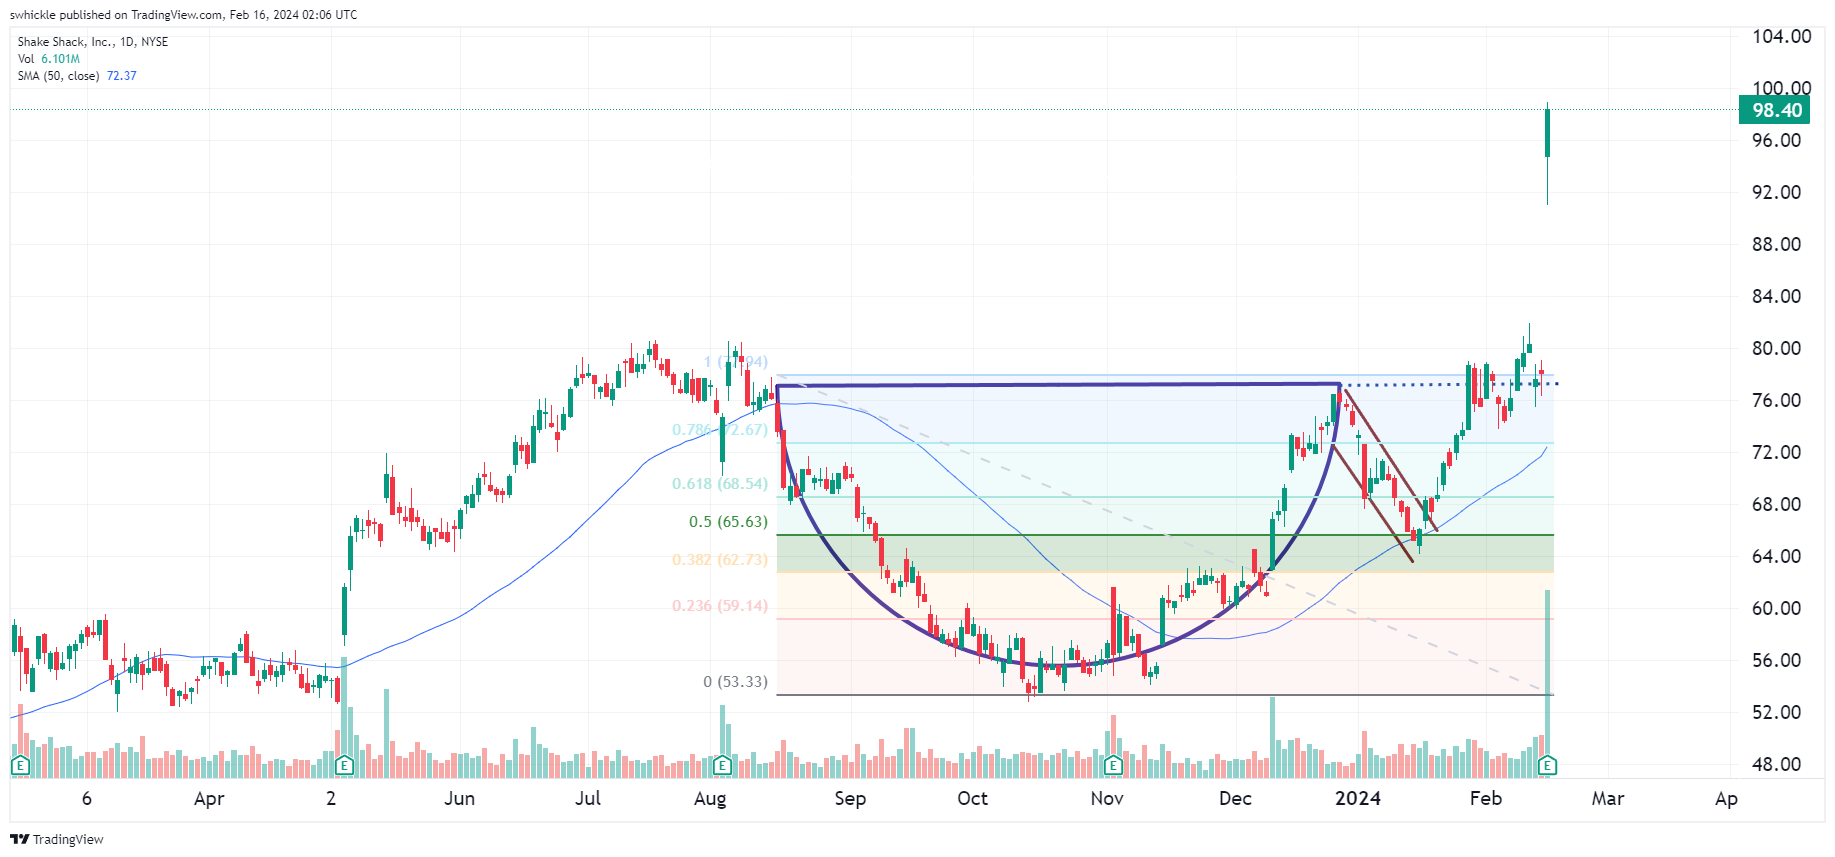
Shake Shack's (SHAK) has crafted a deliciously enticing cup and handle pattern. Yesterday the burger chain was up 26% after reporting higher than expected results for both the top and bottom line. These results combined with a bullish cup and handle continuation pattern resulted in a remarkable move higher. The cup and handle pattern is a bullish continuation pattern formed U shaped chart pattern followed but a counter trend reversal that resembles the handle. The completion of the pattern would come in the form of a breakout to the upside above the rim of the cup. Being able to recognize the pattern is half the battle. For me, I am just as interested in the psychology behind the move as I am in the formation of the chart. Cup and handle patterns are formed when a positive trending stock makes recent new highs. As these new highs are reached, investors want to lock in profits. The resulting selling pressure causes a countertrend move, that eventually bottoms out in a gentle sloping pattern. Renewed optimism slowly drives the stock higher where it retests the former higher completing the “U” shape. Sellers again, step in and fade the move to form a handle. Things get even more interesting when you have a classically formed cup and handle patten whose handle has found support at the Fibonacci 50% retracement level and then it moved higher, retesting the old highs. Trading this pattern can produce false breakouts so it is important to confirm a breakout before getting too excited. After a few attempts at a breakout, earnings were the fundamental catalyst that was needed to cause the stock to technically break out into burger bliss. |
|
|
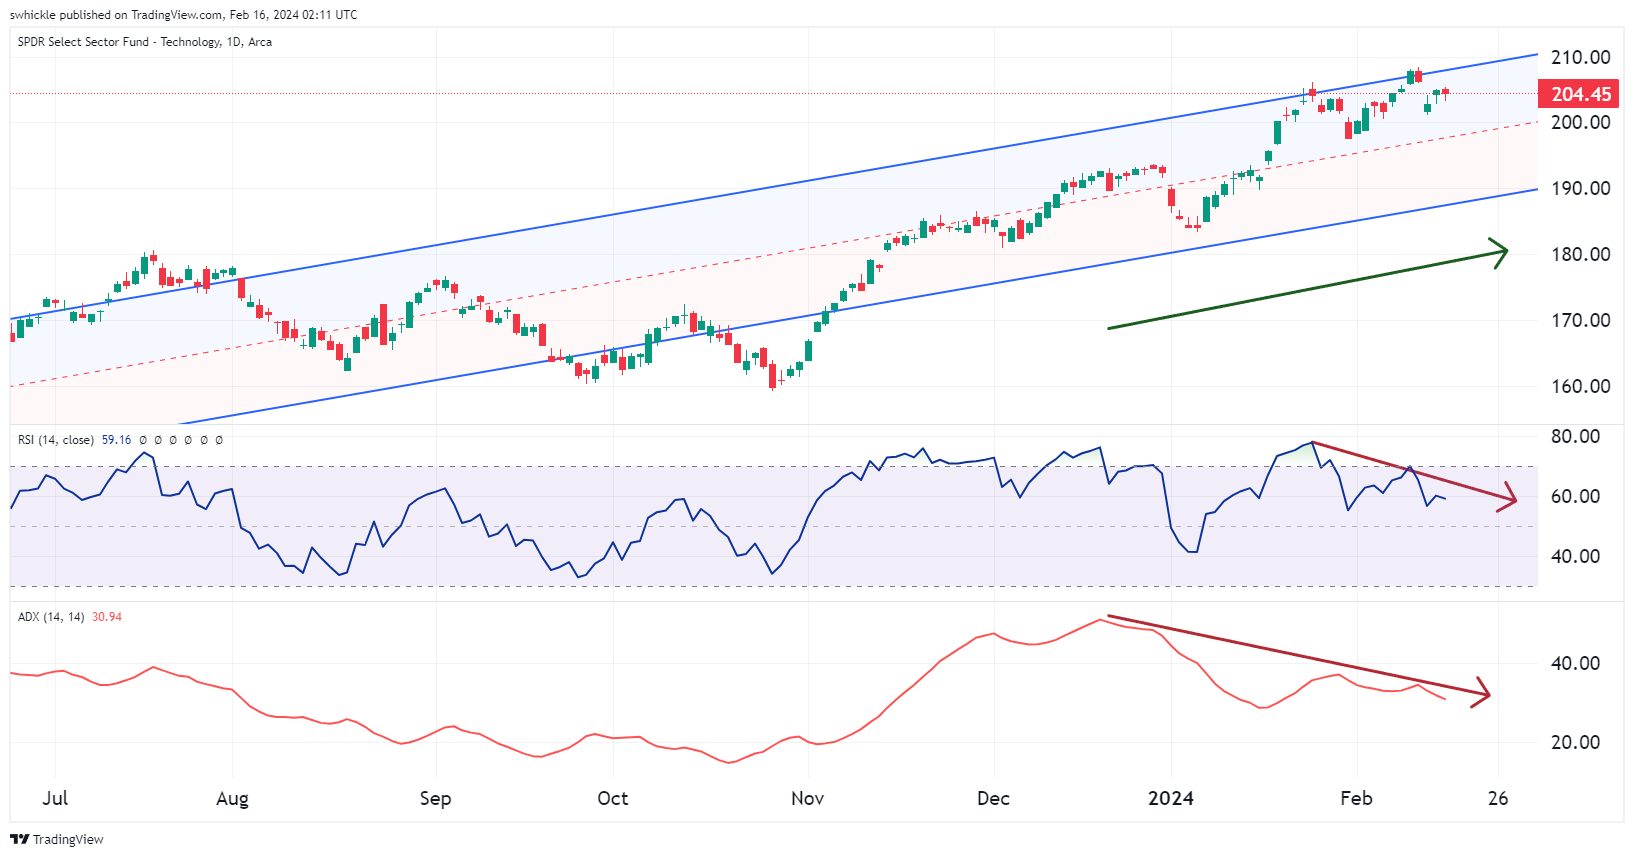
After nearly a 50% move in 2023, the tech sector is in 2nd place in terms of price performance YTD, just trailing behind the communication sector. I think it is imperative to check in periodically assessing the strength of the prevailing trend, as many of my clients have tech forward portfolios. For this I will reach back into my toolbox and use the indicators that have gotten me this far in my career. Revisiting trends ensuring their continuity has become a routine practice. On Tuesday, the Consumer Price Index (CPI) data sent shockwaves through the SPDR Select Sector Technology Fund (XLK ), causing it to open more than 2% below Monday's close. As the XLK serves as a proxy for the tech sector, this significant movement warrants closer scrutiny. Utilizing the XLK, I've incorporated a linear regression channel, which indicates an ongoing uptrend in the sector. Monday's close saw the XLK nearly touching the upper boundary of this channel, signaling potential overbought conditions. However, the subsequent move lower has brought it out of these extreme levels, offering a breather for the market. Such pullbacks from overbought extremes are often seen as healthy corrections within markets, potentially setting the stage for renewed upward momentum. If you have been following along this week you have seen a fair amount of relative strength analysis so it should be no surprise that we use it to see how momentum has been affected in recent days. On Monday we reached another all-time high on the XLK, but the relative strength index (RSI) failed to follow trend, peaking lower than the previous high. This is known as bearish divergence. This same bearish divergence is showing up in other areas of the market such as industrials, financials, and consumer discretionary. |
|
|
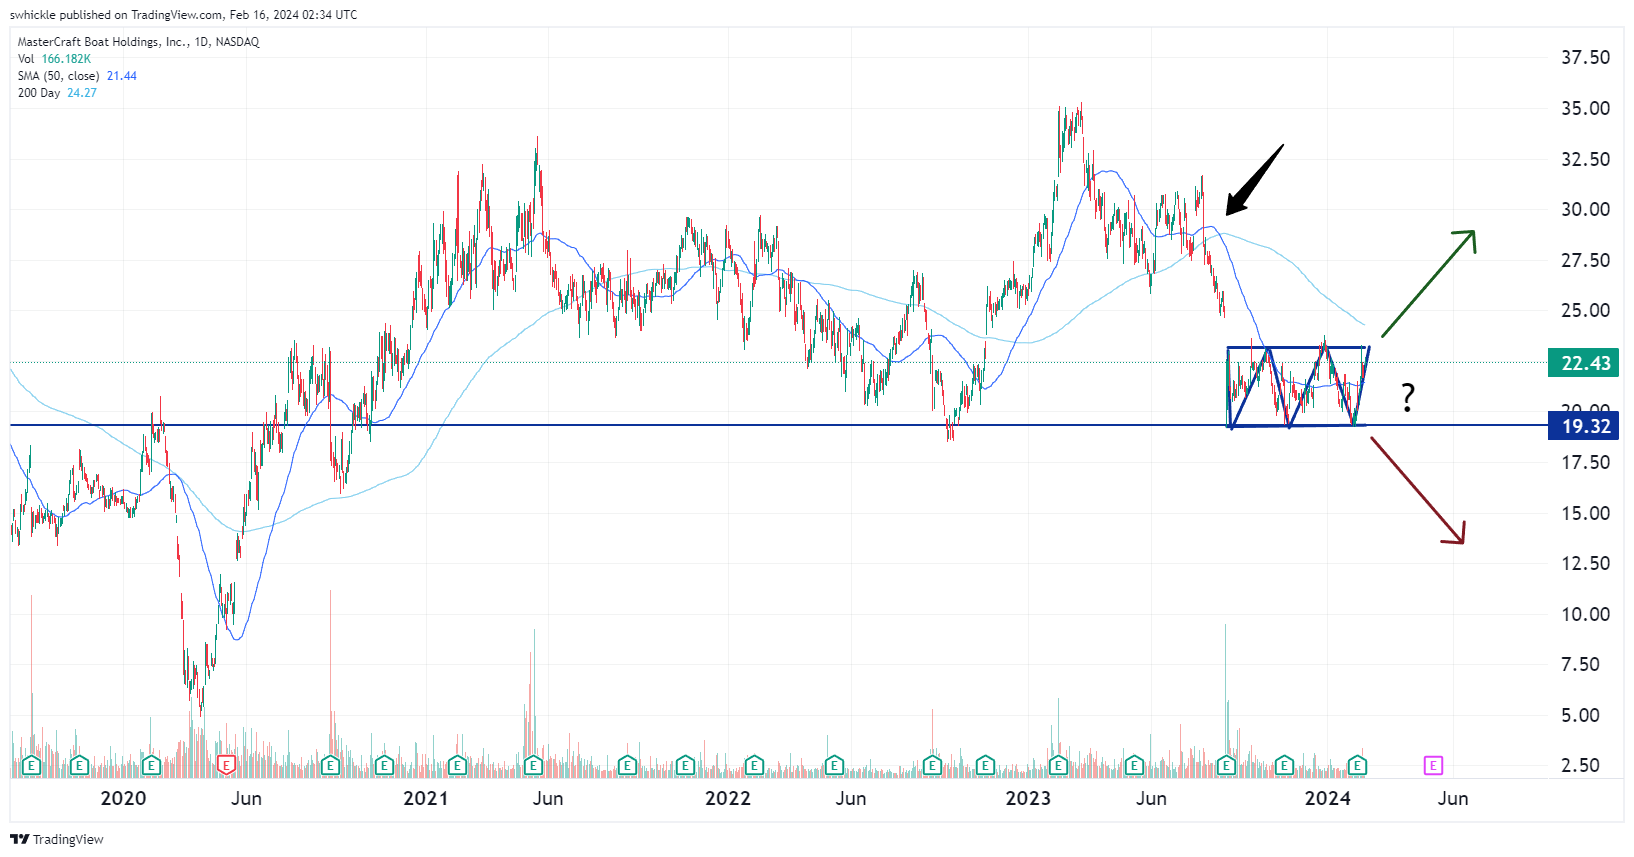
When approached with a trading idea by a client or colleague, I enjoy engaging in what I like to call a game of Battleship. In this game, your idea is akin to a boat, and by the end of our conversation, if your boat is still floating, then perhaps there is merit to explore further. The objective isn't to be harsh and tear apart the person's idea, but rather to strengthen it by exposing its weaknesses. Playing devil's advocate is a crucial aspect of the investment process. Being an echo chamber of bad ideas leads to poor trades and worse client experiences. So, let's put this boat to the test and examine Master Craft Boat Holdings (MCFT). The stock has been meandering sideways with a slight negative slope since late 2020. As boats fall into the consumer discretionary sector, it's worth noting that MCFT has been underperforming the sector over the past year, even as market averages reach all-time highs. Trading at less than 10 times forward earnings, it appears relatively inexpensive compared to the S&P 500. Although analyst expectations have been slightly reduced over the last 90 days, MCFT has consistently surpassed analyst expectations for both top and bottom lines every quarter since September 2020. Taking a quick look at the chart, one can see that the stock is resting on long-term support . Following a decline from the 2023 highs, MCFT experienced a gap down, consolidating sideways and forming a rectangle pattern. In August of '23, the 50-day SMA crossed below the 200-day SMA, a bearish signal known as a death cross. In my experience, stocks trading below the 200-day SMA seldom yield positive outcomes. I suspect that at some point, MCFT will break out of this trading range. However, which direction it will move in remains uncertain. Truthfully, I don't have the answer, and neither does anyone else. The most important question you must ask yourself is whether this idea represents the best use of your time and capital. Does your boat still float? Are you prepared to embark on a boat ride, or would you rather let it sink? Ultimately, only you can answer that question. If you decide to go on a ride, have a plan, pack some life preservers just in case. |
|
|
Seth Hickle, CMT is a Chartered Market Technician (CMT) who’s passion for the markets led him to discover the power of technical analysis. His core investment belief is fundamental analysis will help us understand where an asset should be priced, technical analysis will help us understand the path it takes to get there. Seth is a Derivatives Portfolio Manager for Innovative Portfolios and sister company Sheaff Brock Investment Advisors where he manages derivative based strategies with a focus on harvesting volatility risk premium. |
|
|
You are receiving this newsletter because you subscribed to the Chart Advisor newsletter. If you wish to unsubscribe, please click here. Dotdash Meredith 225 Liberty St, 4th Floor, New York, NY 10281
© 2024 All Rights Reserved. Privacy Policy | Terms of Service |
|
|
|