By C. Theodore Hicks II, CFP®, CKA®, CMT®
|
|
|
2/ Everyone Is Participating |
|
|
Investopedia is partnering with CMT Association on this newsletter. The contents of this newsletter are for informational and educational purposes only, however, and do not constitute investing advice. The guest authors, which may sell research to investors, and may trade or hold positions in securities mentioned herein do not represent the views of CMT Association or Investopedia. Please consult a financial advisor for investment recommendations and services. |
|
|
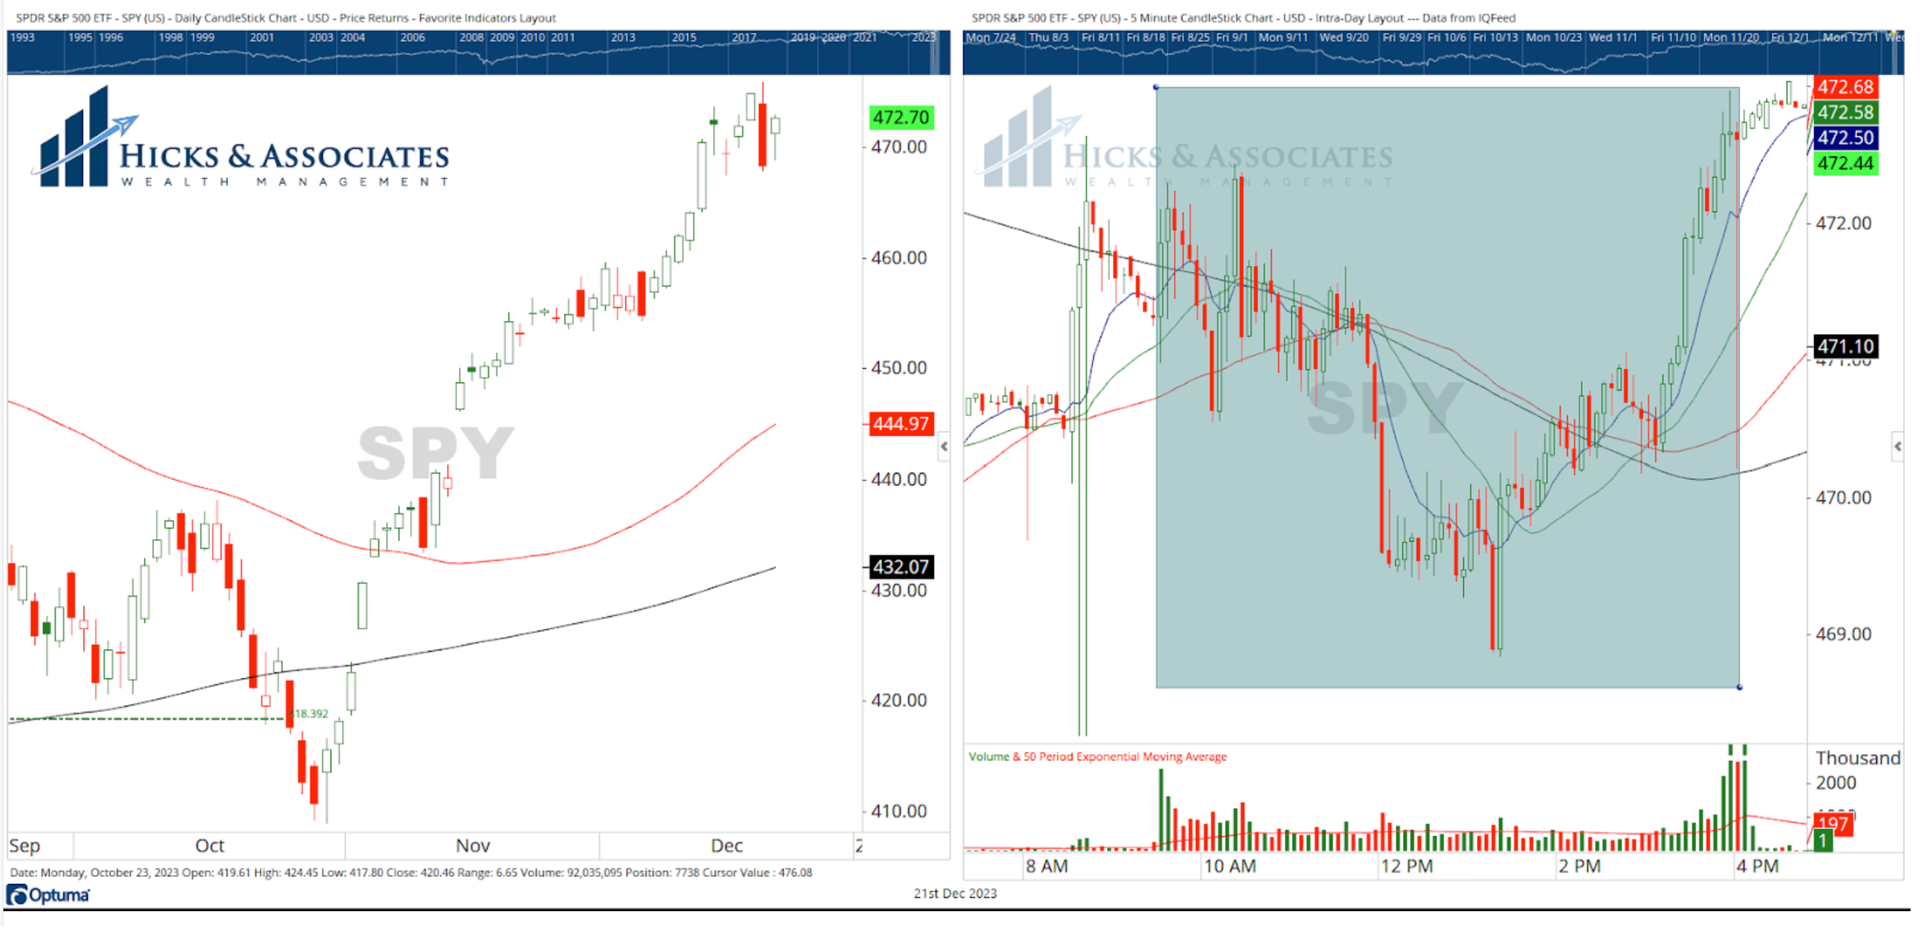
On the left, we have the daily candle chart for SPY, one of the S&P 500 ETFs. On the right, we have its 5-minute candle chart. The shaded box represents the actual trading hours of 9:30 to 4:00 eastern. While Wednesday’s trading session turned sour shortly after lunch, Thursday was just the opposite. For the uninitiated, the bottom of a white candle’s body represents the opening price. The top of the white candle’s body represents the close. The upper and lower wicks represent the extent of the day’s range. So, for Thursday, we can see that the S&P 500 opened the day higher than Wednesday’s close. However, the bears dominated the first three hours of trading. But, as you can see on the 5-minute chart, the bulls showed up after lunch and the index rallied strong all the way into the close. Such a reversal is a nice sign. It suggests that it is possible that the downside pressure we saw on Wednesday will be contained to Wednesday. If so, if Friday’s trading session is flat or positive, we will close out an eighth week in a row of gains. |
|
|
Financial market research from professionals at the forefront of technical analysis innovation. |
|
|
Everyone Is Participating |
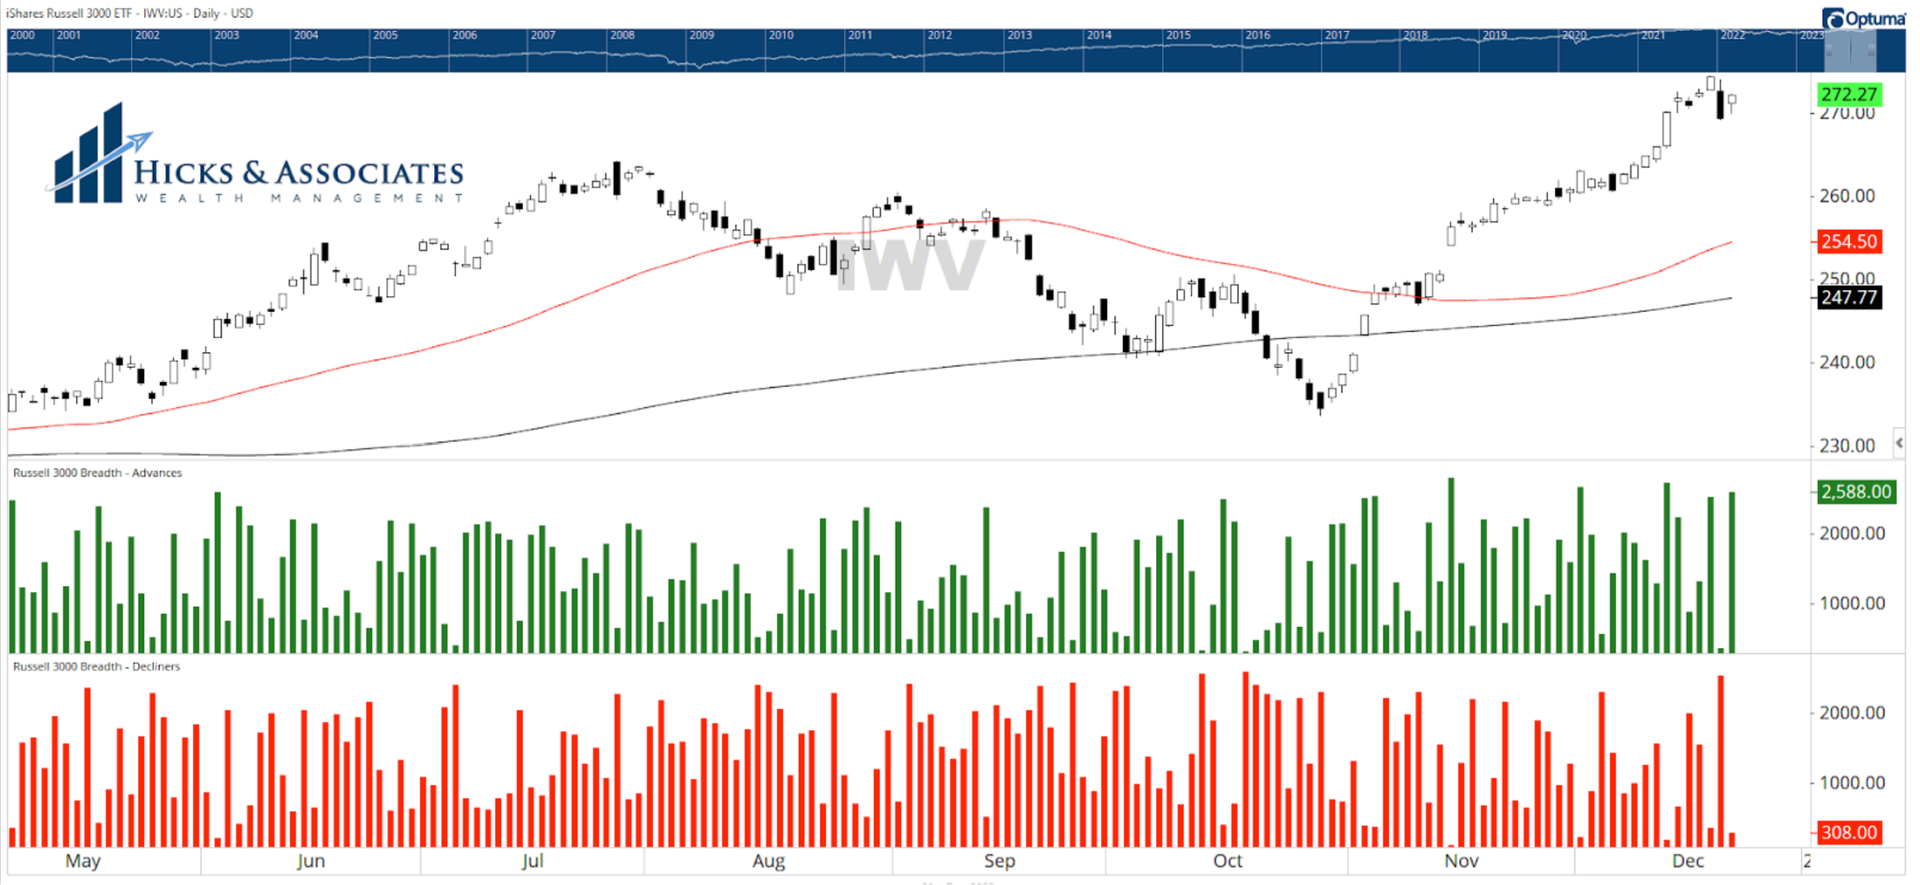
The top pane of our second chart is the iShares Russell 3000. The bottom panes are showing the number of advancing stocks (green bars) and declining stocks (red bars) within the Russell 3000. Take a look at Wednesday’s bars and then compare them to Thursday’s bars. On Wednesday, there were very few stocks advancing - the green bar for the day is almost non-existent. Conversely, just about all of the Russell 3000 stocks were declining. On Thursday, it was just the opposite. The broad market has run up so much that just about every stock needed to take a breather. But the very next day, it was back to work. |
|
|
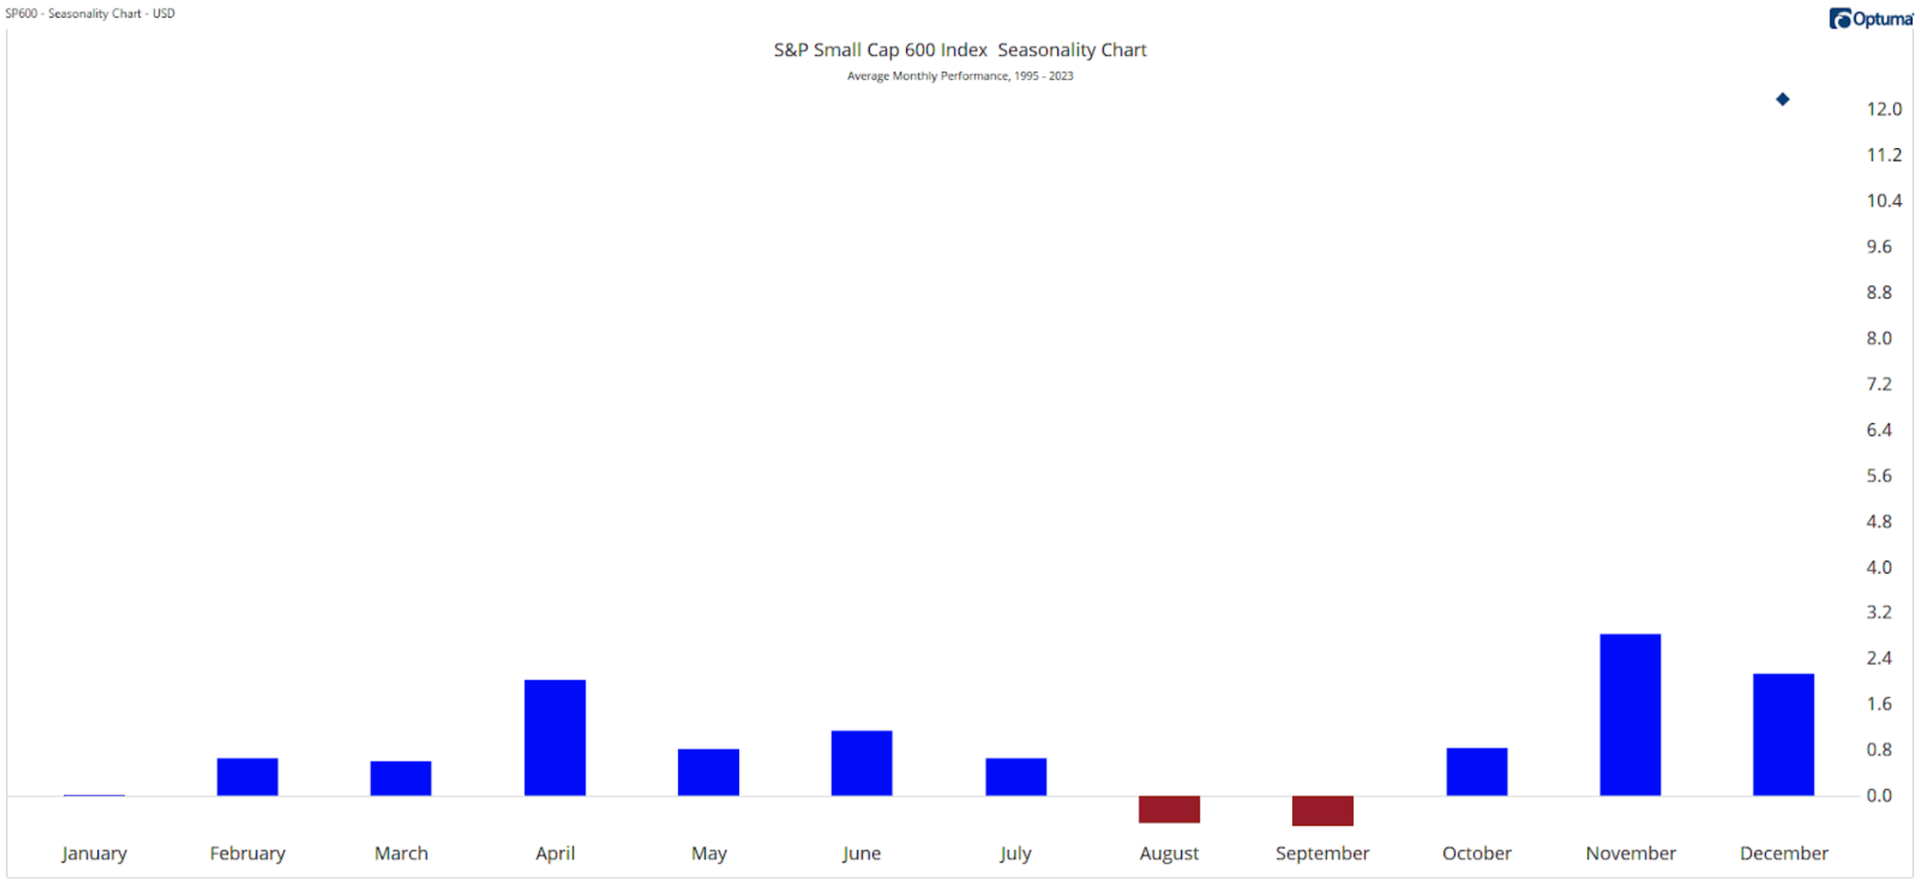
Earlier this week, I pointed out that small company stocks have been leading the charge since this latest rally began on November 1st. Chart 3 is a Seasonality Chart for the S&P Small Cap 600 Index. This is showing us the average monthly performance for the S&P Small Cap 600 since 1950 by month. Note the blue dot on the right hand side. This blue dot is representing the performance for the S&P Small Cap 600 for the current month. This month’s performance is significantly higher than the average December! While I like Small Cap’s chances in the months ahead, in some measure because they have struggled for so long, I also am very aware of how the average January is not very robust for small company stocks. |
|
|
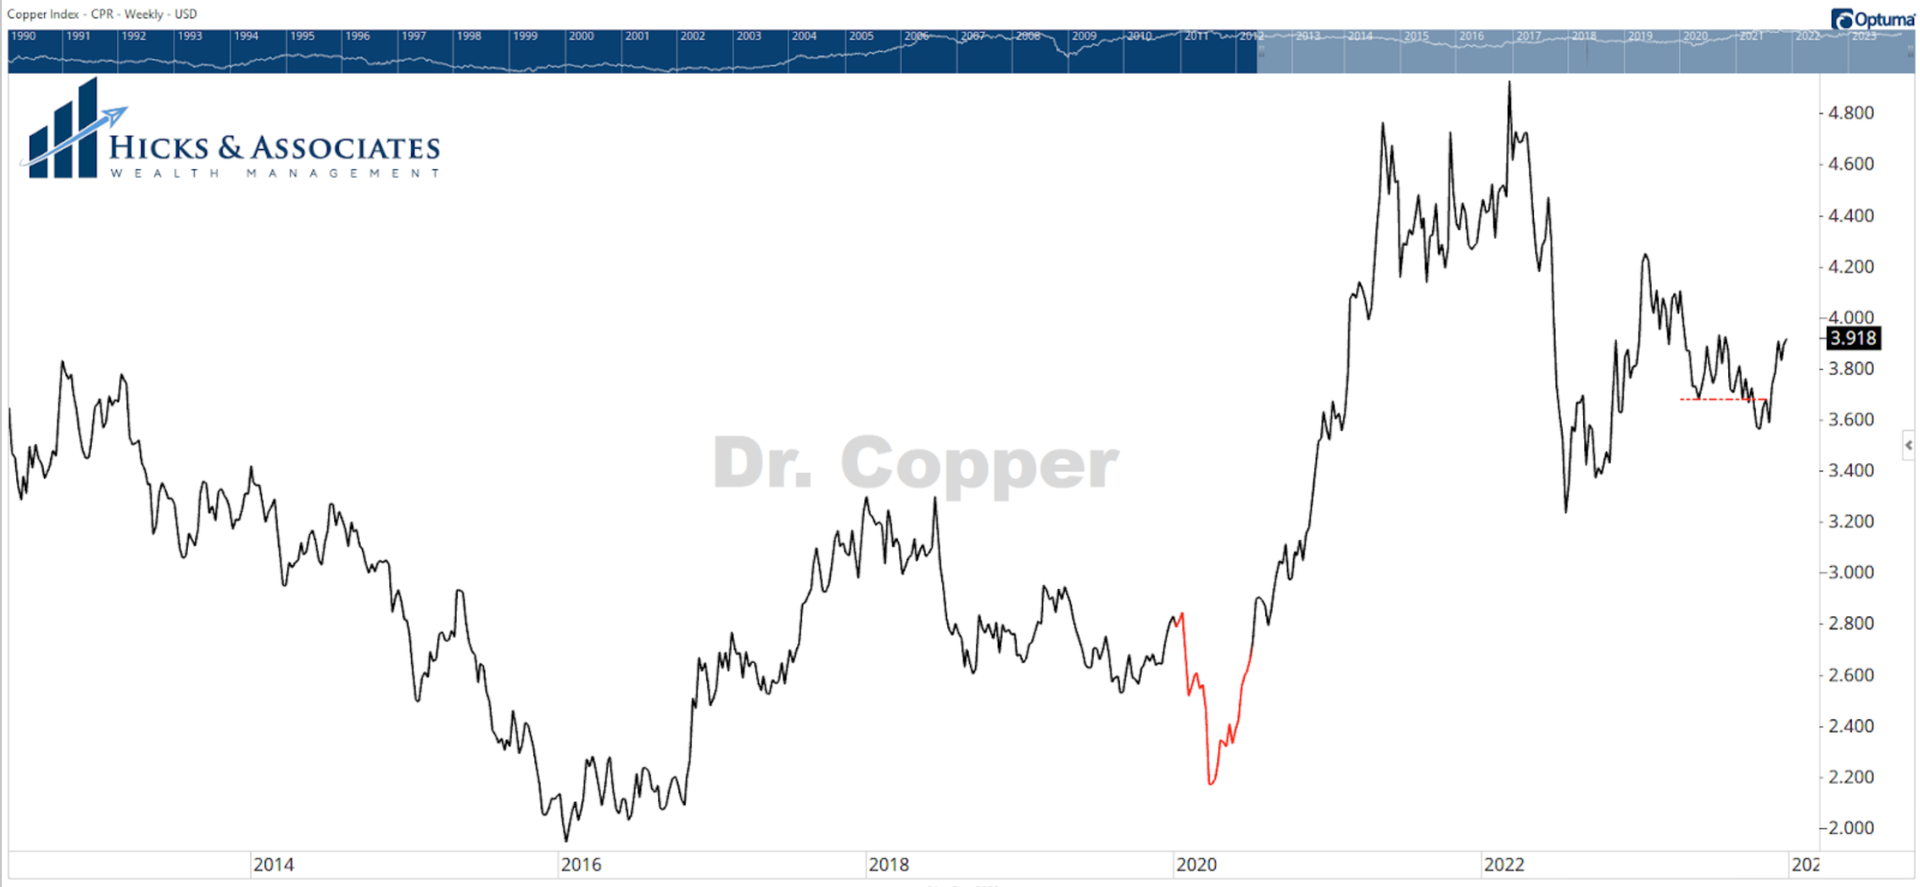
The final chart for today is the chart for copper. Copper is frequently called “Dr. Copper” as it is said that copper has a PhD in economics. Since copper has many industrial uses, its price is very sensitive to economic conditions. On the right side of the chart, you can see where I added a red horizontal line. I had noted in one of our YouTube channel reports that I was concerned that copper had fallen through that support level. It has since gone on a nice rally and almost taken out the peak from July 2023. From an economic standpoint, this is expansionary. Merry Christmas everyone. |
|
|
Theodore Hicks, CMT is the Founder and Chief Investment Officer for Hicks & Associates Wealth Management, an SEC Registered Investment Adviser. Hicks and his team manage money for families and retail clients using a proprietary, multi-strategy investment process through a rules-based framework. Since most of their clients are either near or already in retirement, the process is designed to minimize downside risk. Hicks frequently posts charts and his thoughts to his LinkedIn and Twitter accounts. |
|
|
You are receiving this newsletter because you subscribed to the Chart Advisor newsletter. If you wish to unsubscribe, please click here. Dotdash Meredith 225 Liberty St, 4th Floor, New York, NY 10281
© 2023 All Rights Reserved. Privacy Policy | Terms of Service |
|
|
|