1/ Good Overbought Condition |
2/ Internal Trends are Positive |
3/ Risk is for a Sharp Pullback |
4/ Strong Breakout from Uranium/Nuclear Energy |
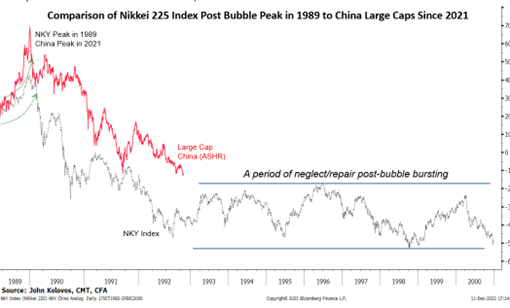
5/ Is China the New Japan? |
|
|
Investopedia is partnering with CMT Association on this newsletter. The contents of this newsletter are for informational and educational purposes only, however, and do not constitute investing advice. The guest authors, which may sell research to investors, and may trade or hold positions in securities mentioned herein do not represent the views of CMT Association or Investopedia. Please consult a financial advisor for investment recommendations and services. |
|
| Good Overbought Conditions |
Courtesy of John Kolovos, CMT, CFA & Bloomberg |
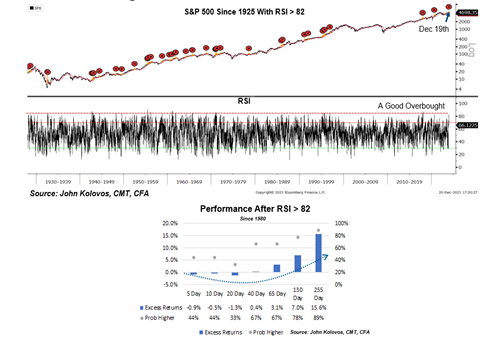
January's pullback in stocks is consistent with how good overbought conditions typically resolve and have inflicted little damage to internal and external trends. As chart 1 illustrates, as a result of the numerous breadth thrusts since the October ’23 low, a good overbought condition occurred when the RSI on the S&P 500 index surpassed 82. Contrary to popular belief, there is such a thing as a “good overbought.” The chart highlights when these have occurred in the past, and the table shows the historical performance of the S&P 500 since 1980 after such good overbought conditions were met. The market underperformed for two months but has a +70% odds of being higher after that with very asymmetric positive payoffs. One year later, there is an 89% chance of seeing a higher tape, with an average return of 15%. The current setback is consistent with a near-term setback, and given that trends are still positive (see below), the current outlook is favorable for stocks. |
|
|
Financial market research from professionals at the forefront of technical analysis innovation. |
| |
Internal Trends are Positive |
Courtesy of John Kolovos, CMT, CFA & Bloomberg |
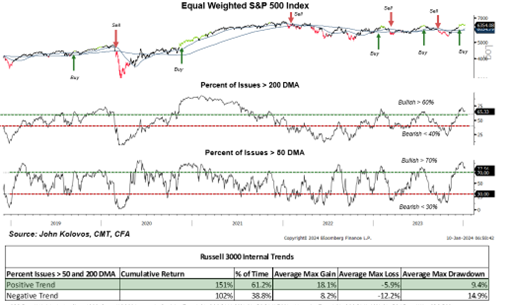
Always side with the trend, be it what the index is showing or that of its constituents. It is difficult to view the stock market’s current trend as anything but positive on an intermediate-term basis, which is also supported by the positive trends for the “market of stocks.” Chart 2 and the accompanying table illustrate that despite the January setback, most stocks remain above their key moving averages, specifically the 50 and 200-day averages. When trend is positive, the return profile is asymmetric, meaning downside risks are typically limited. At the same time, upside gains have the potential to be three to four times the average loss. When the vast majority of the constituents are in an uptrend, we can create portfolios that are less concentrated and vulnerable to idiosyncratic risk. Strong internal trends also speak to positive breadth, a key characteristic of a healthy equity market. |
|
|
Risk is For a Sharp Pullback |
Courtesy of John Kolovos, CMT, CFA & Bloomberg |
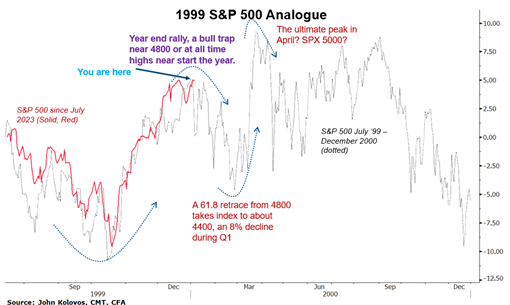
The tricky part since the beginning of the year has been navigating the consolidation phase. Outside of Small Caps, most stocks are consolidating sideways through time and not meaningfully lower via price. The risk, however, is that we are about to commence on a sharp retracement of the October recovery, which is supported by overly bullish sentiment, market cycles, and the 1999 analog, which suggests a proper correction into February, is following that script nearly perfectly. To that end, a deeper retracement will be signaled on a break of 4700, which will open the doors for a move not only to 4600 but a 1/3 retracement to the 4500 area. |
| |
Strong Breakout from Uranium/Nuclear Energy |
Courtesy of John Kolovos, CMT, CFA & Bloomberg |
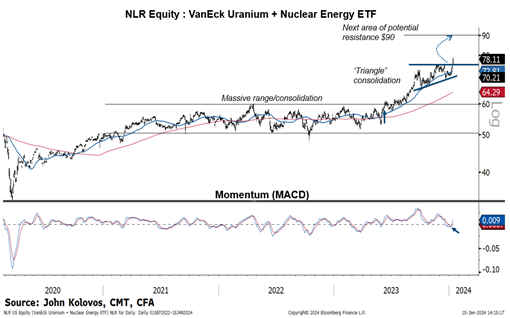
Areas that are particularly vulnerable on the charts are Discretionary and Retail (XLY, XRT), Industrials (XLI and JETS), Emerging Market Bonds (EMB), Solar (TAN), and Agribusiness (MOO). On the flip side, Communication (XLC), Insurance (KIE), Software (IGV), Cyber Security (HACK), Health Care (XLV, IBB), Small Cap Staples (PSCC), Japan (EWJ), and India (INDA), are near new highs (XLC). NLR, the VanEck Uranium+Nuclear Energy ETF, busted out to new highs last week and is a solid chart where any setbacks should be used opportunistically above the Dec '23 lows. (This starkly contrasts with Clean Energy plays such as PBW or TAN). See chart 4. |
| |
Courtesy of John Kolovos, CMT, CFA & Bloomberg |
Overseas, momentum favors only slight allocation, but EAFE (developed international) is still preferred over Emerging Markets in our work. Within EAFE, Core Europe is leadership, but Japan’s charts clearly show a strong breakout to new highs in local terms. As for EM, strength remains outside of China (India, Latin America), as it does look like China is the new Japan. As chart 5 shows, Chinese equities are following the common post-bubble script, where after a sharp reversal in excess of 50%, a prolonged period of neglect follows. This occurred after the Nikkei 225 peaked in 1989 or we can also see this type of behavior post the Tech bubble bursting in 2000, or the Dow Jones Industrial Average leading up to the Great Depression in 1929. The result could lead to a very tactical whipsaw prone, and rangebound environment for Chinese stocks going forward. |
| |
John Kolovos, CFA, CMT is Head of Technical Strategy at Macro Risk Advisors. In this role, John is responsible for delivering high-conviction investment insights for institutional cleints, identifying tactical trading opportunities, and analyzing cross-asset relationships between stocks, commodities, currencies, and interest rates from across the globe. John has been one of Wall Street’s most sought-after macro-based analysts for over 20 years, and is a frequent guest on CNBC and Bloomberg TV and is widely quoted in the financial press. John is also an adjunct professor at Brandies University, where he teaches a graduate-level course on Technical Analysis and is very active in the technical analysis community by serving on the executive committee as Vice-President for the Charted Market Technicians Association (CMT) as well as sitting on the Governance committee. |
|
|
You are receiving this newsletter because you subscribed to the Chart Advisor newsletter. If you wish to unsubscribe, please click here. Dotdash Meredith 225 Liberty St, 4th Floor, New York, NY 10281
© 2024 All Rights Reserved. Privacy Policy | Terms of Service |
|
|
|