3/ 16-Years of Relative Strength |
|
|
Investopedia is partnering with CMT Association on this newsletter. The contents of this newsletter are for informational and educational purposes only, however, and do not constitute investing advice. The guest authors, which may sell research to investors, and may trade or hold positions in securities mentioned herein do not represent the views of CMT Association or Investopedia. Please consult a financial advisor for investment recommendations and services. |
|
|
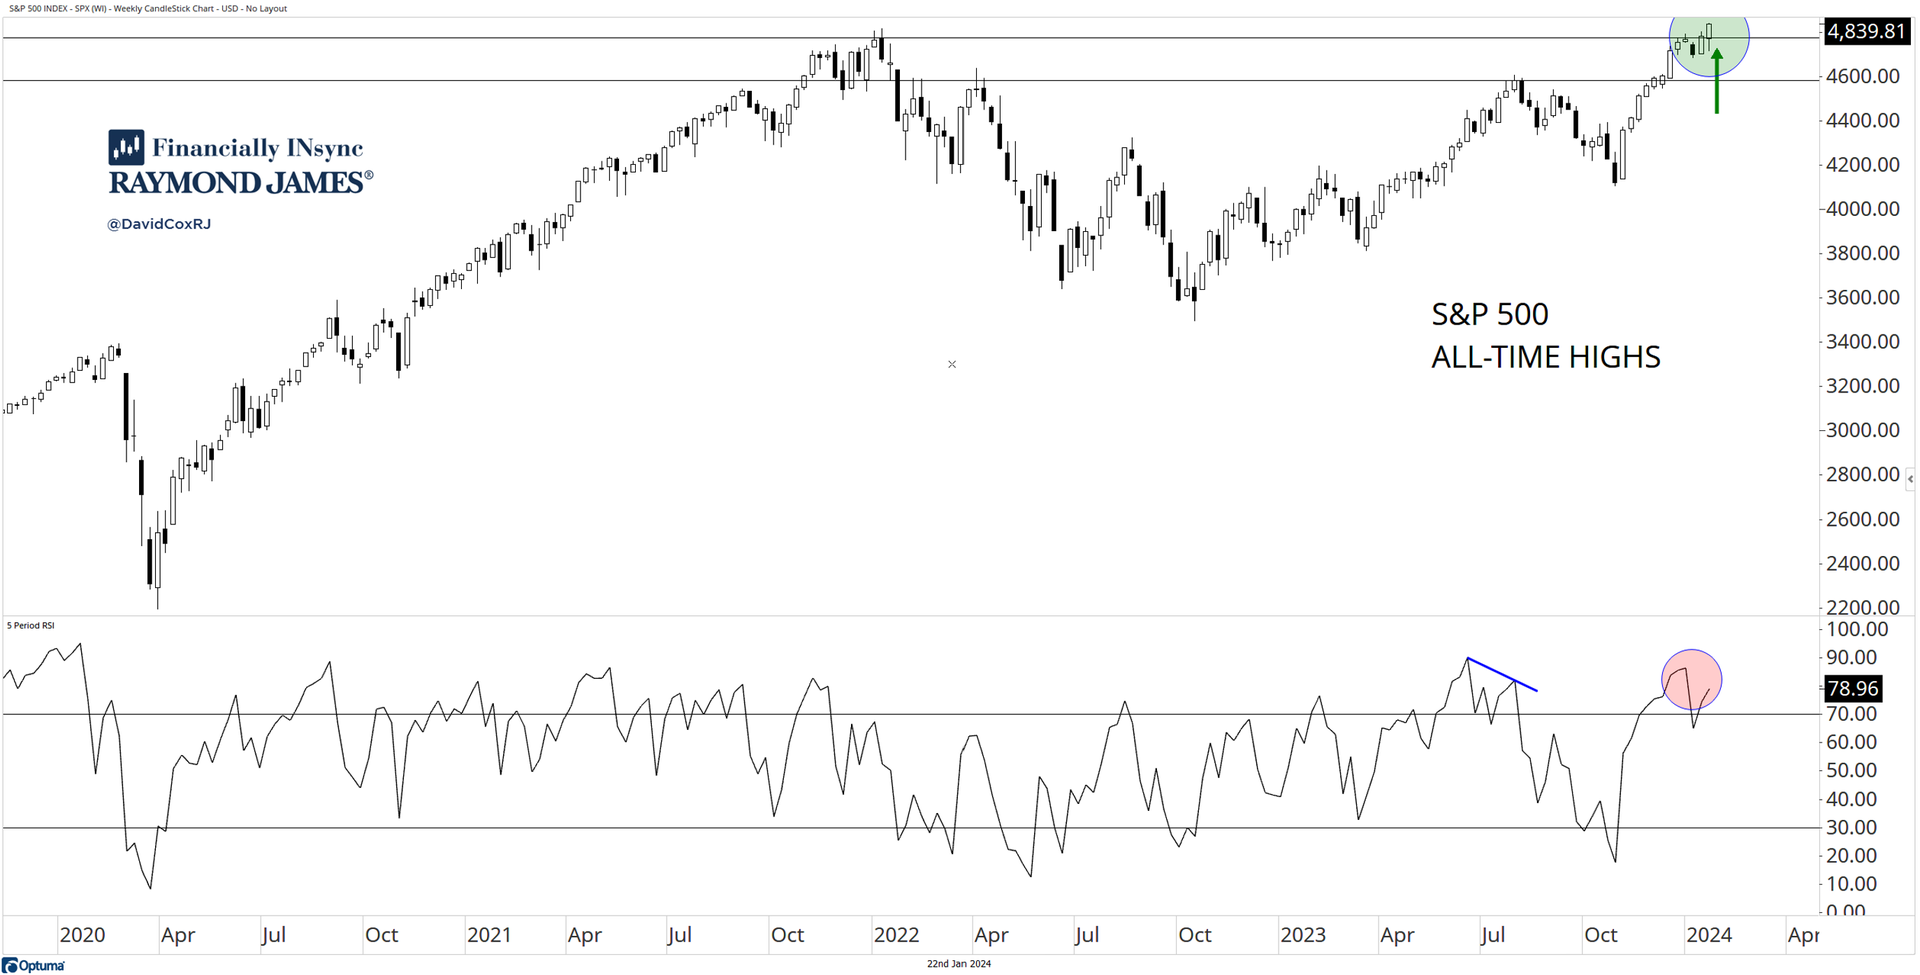
All-time highs. For all the debate about whether stocks should go up, or can go up further, one thing is certain, they just made all-time highs. At all-time highs, there are no investors sitting in a losing position on their exposure and instead, it’s the short sellers who are on the wrong side and who sit with losses. And those short sellers remain fuel for the future, given they represent forced buying vs. the rest of investors who can make their own informed decisions. When prices push past prior highs, which can offer resistance, they take away another piece of the bearish narrative that some have clung to, since the market bottomed 15-months ago. |
|
|
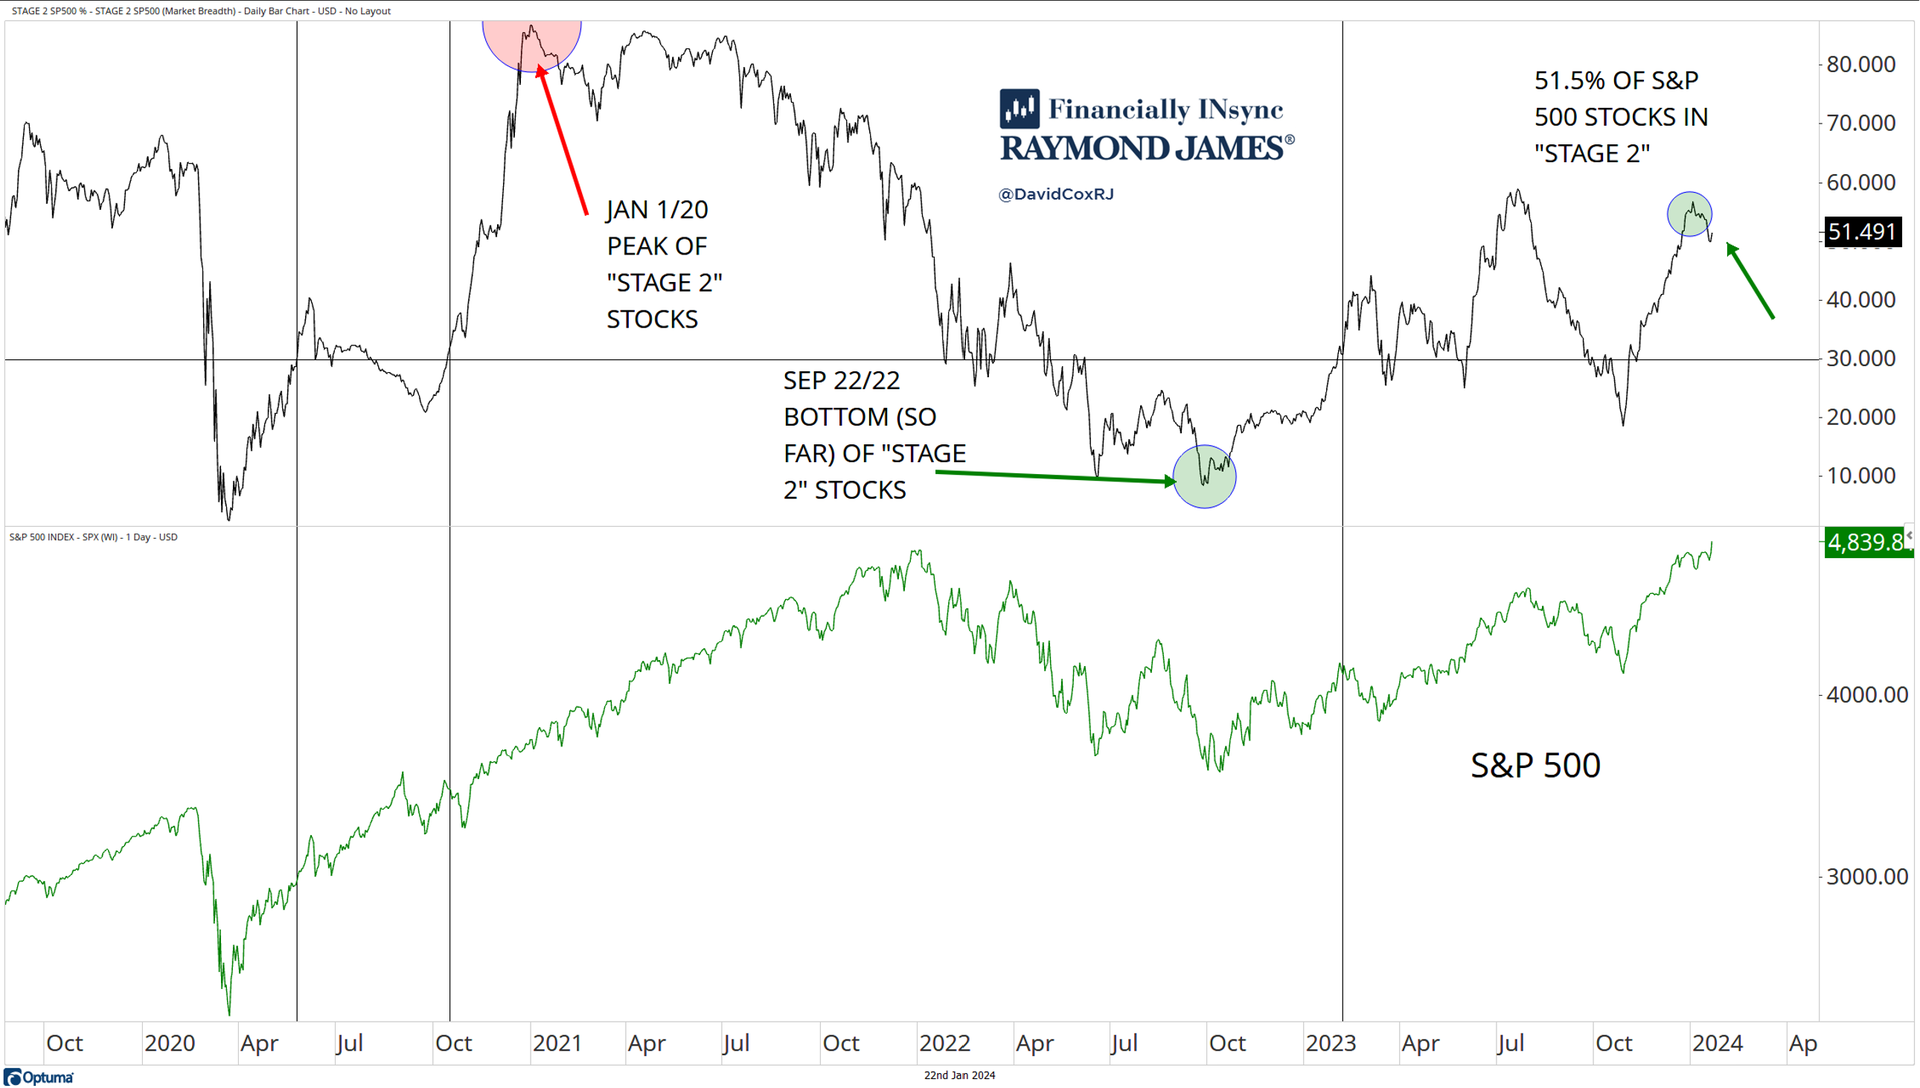
Following on the work of Stan Weinstein, I like to keep an eye on the percentage of stocks that are in a #Stage2 uptrends. How do we define it? Price needs to be above a 200-day moving average. The 150-day moving average must be above the 200-day moving average AND, the 200-day moving average must be rising itself. When the % of stocks in #Stage2 uptrends improves to more than 30% after a bear market, it tends to evidence sufficient improvement to see higher prices. The S&P 500 currently has 51.5% of stocks in #Stage2 uptrends. Not nearly what we saw at the highs in 2020 (yet?), when more than 80% of stocks were there, which perhaps offers lots of room yet for further improvement. |
|
|
16-Years of Relative Strength |
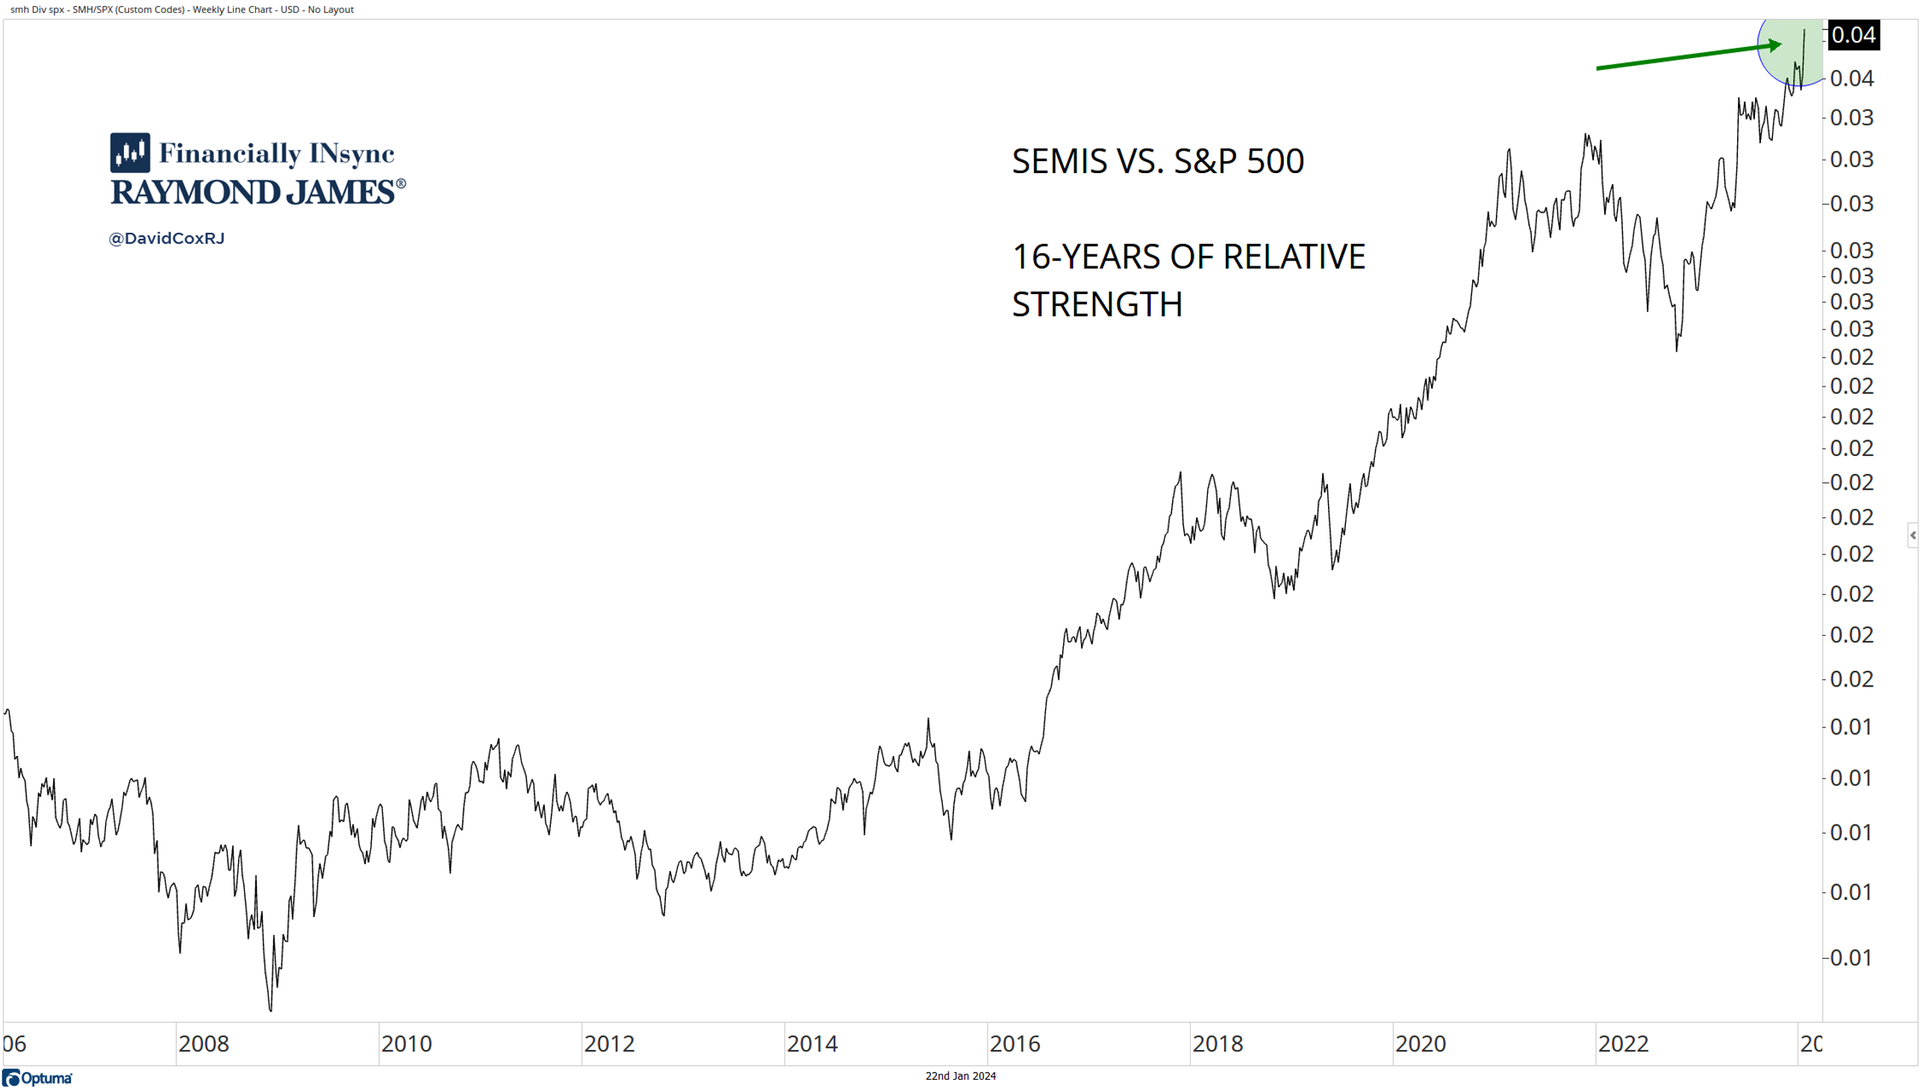
Many investors spend an inordinate amount of time trying to figure out what stock is going to rise, or what stock deserves to fall. By using relative strength, we can seek to understand what stocks, or groups of stocks, are rising (or falling) more strongly than the market itself. Because if we as investors, want to beat (outperform) the stock market, we have own stocks that are rising more strongly. The semiconductor stocks are shown here, vs. the S&P 500. The chart shows that since the 2008 lows, the semiconductor stocks have been in a relative uptrend for the past 16 years (that’s a LONG time!). And so any debate about this group of stocks aside, do know, that a 16-year relative weekly chart won’t change on a dime or with a down day in the market. Know the trend and follow the trend, until the trend ends. |
|
|
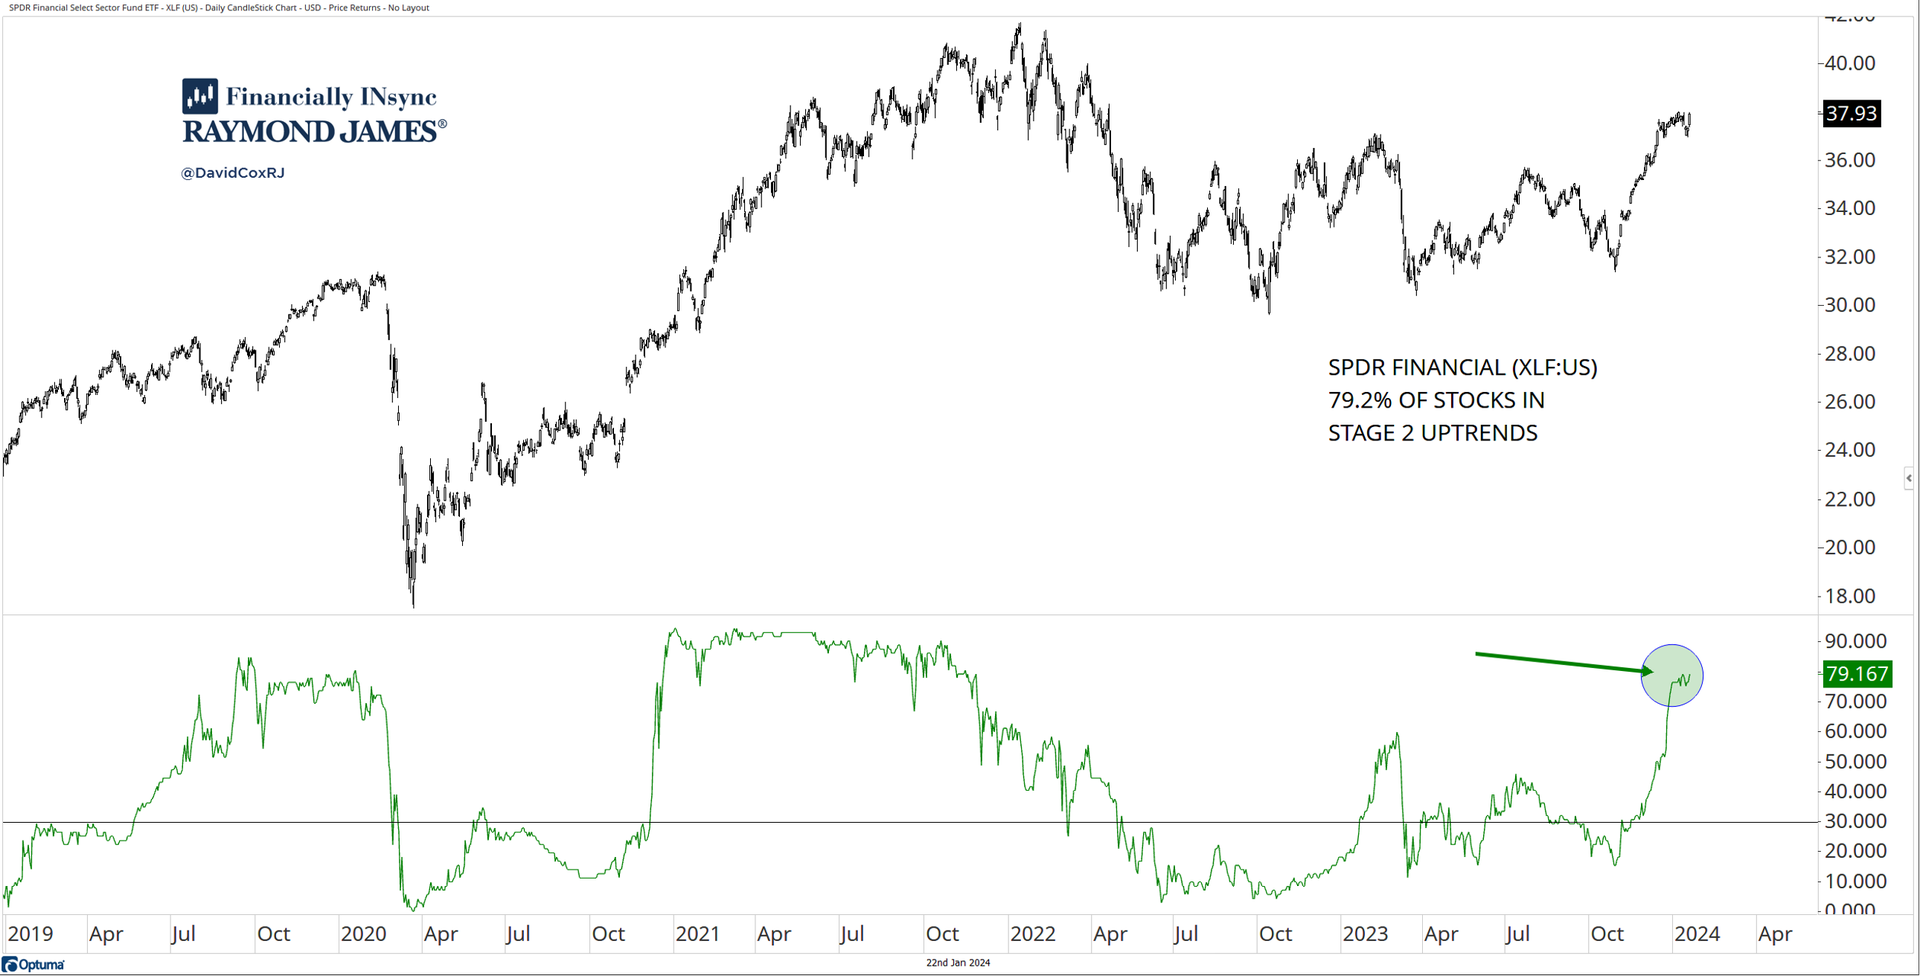
The financials have been pretty weak for some time and certainly far from an exciting part of the market since the 2022 lows. But we’re seeing some very constructive action if we look underneath, and in this case, let’s do some more Stage 2 analysis on the SPDR Financials ($XLF) sector. You can see that we just saw a surge of stocks come to life after the August – October, 2023 correction and we now have 79.2% of stocks in #Stage2 uptrends, the highest level since 2021. |
|
|
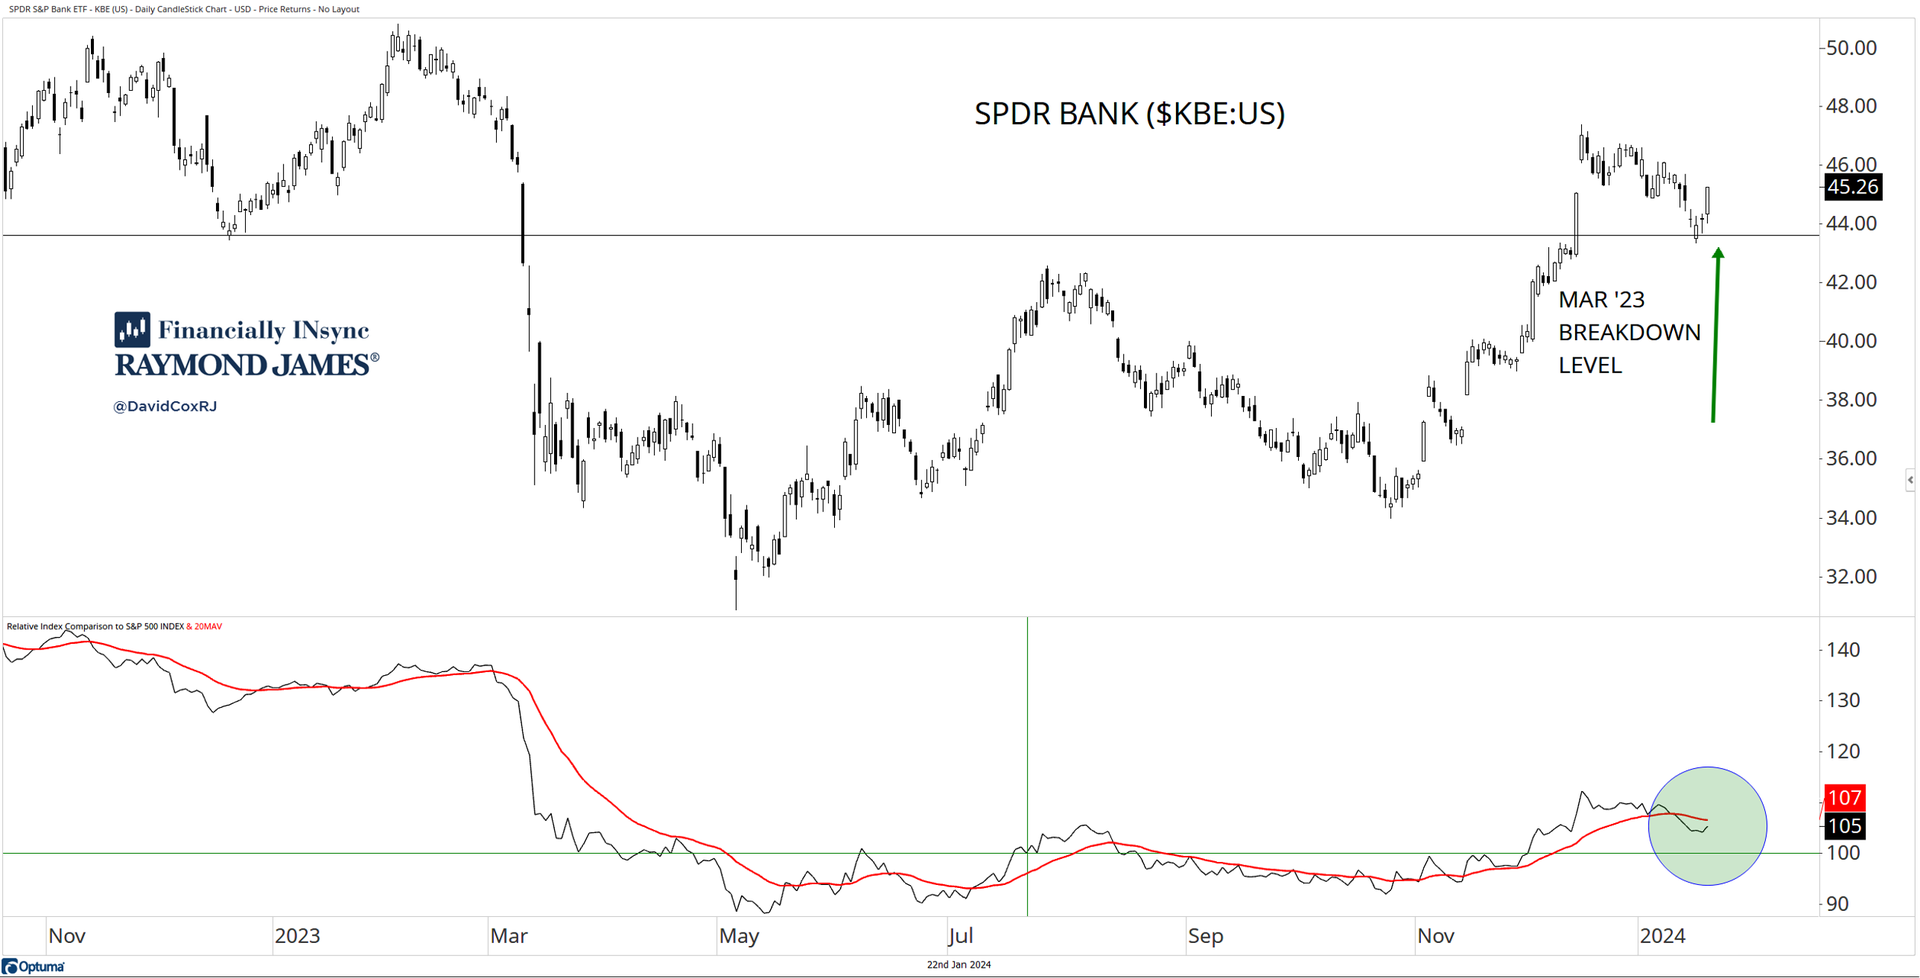
With the improvement just discussed in the financial sector, let’s look at another chart, this time of the SPDR Bank ETF ($KBE), which itself is in a relative uptrend vs. the SPDR Financial ($XLF) and outperforming the broader sector. It has reclaimed March ’23 breakdown level, that happened when a number of U.S. financial institutions collapsed, and that in itself is constructive action. Now, you can see on the daily chart (green arrow), a pullback against the recent breakout and right down to the line that marked the collapse level. In the bottom panel, we can see further, that the $KBE is outperforming the S&P 500 by about 5% over the past six-months. Relative strength helps us, so let’s be open minded about what it tells us, regardless of our own opinions. |
|
|
About This Week's Authors |
David Cox, CMT, CFA, FCSI, FMA is a dual holder of both the Chartered Market Technician (CMT) and the Chartered Financial Analyst (CFA) designations and is a Senior Portfolio Manager at “Financially Insync” at Raymond James Ltd., in Waterloo, Canada. He manages assets for Canadian, U.S. and International clients using a fundamentally screened, yet technically driven process and produces a weekly webinar called “Where Do We (Investors) Stand?” each Friday. You can find him on “X” at @DavidCoxRJ as he openly and candidly shares charts and perspectives without bias. |
Conor White, CMT, CIM started his career in wealth management in August of 2017. He holds both the Chartered Market Technician (CMT) and Chartered Investment Manager (CIM) designations. He graduated from Wilfrid Laurier University's Honours Bachelor of Business Administration (BBA) program in 2015 with a concentration in Finance and Economics. Trade analytics, attribution, security screening, order execution, and technical market research are among his many responsibilities as part of the Financially INsync team. Born and raised in Guelph, his interests include music, travel, art and technology. |
|
|
You are receiving this newsletter because you subscribed to the Chart Advisor newsletter. If you wish to unsubscribe, please click here. Dotdash Meredith 225 Liberty St, 4th Floor, New York, NY 10281
© 2024 All Rights Reserved. Privacy Policy | Terms of Service |
|
|
|