1/ The Asbury 6: Positive as of November 2nd |
2/ A Decline Below S&P 500 4694 Could Trigger an Overdue Correction |
3/ The S&P 500 Is Particularly Vulnerable Below 4694 |
|
|
Investopedia is partnering with CMT Association on this newsletter. The contents of this newsletter are for informational and educational purposes only, however, and do not constitute investing advice. The guest authors, which may sell research to investors, and may trade or hold positions in securities mentioned herein do not represent the views of CMT Association or Investopedia. Please consult a financial advisor for investment recommendations and services. |
|
|
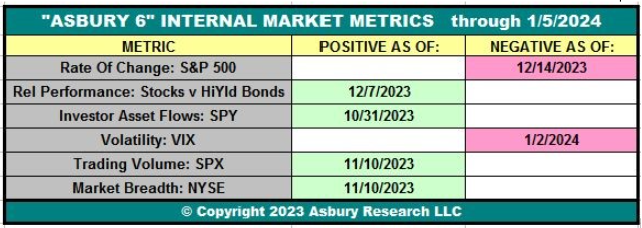
The Asbury 6: Positive as of November 2nd |
Courtesy of Asbury Research LLC |
The graphic shows that, through Friday, January 5th, four of the Asbury 6 constituent metrics are green (positive). The “A6” shifted to a Positive status on Nov 2nd while the S&P 500 has subsequently risen by as much as 11.0%. Four or more constituent metrics in one direction, either Positive (green) or Negative (red), indicate a tactical bias. The dates in each cell indicate when each individual constituent of the “A6” turned either positive (green) or negative (red). When all Asbury 6 constituent metrics are negative, market internals are the least conducive to adding risk to portfolios. |
|
|
Financial market research from professionals at the forefront of technical analysis innovation. |
|
|
A Decline Below S&P 500 4694 Could Trigger an Overdue Correction |
Courtesy of Asbury Research LLC |
Correction Protection Model (CPM): Risk on as of November 2nd
CPM, our primary quantitative model for the US stock market which uses the S&P 500 (SPX) as a proxy, shifted to “Risk On” (increasing market exposure) as of the close on November 2nd from “Risk Off” (decreasing market exposure) on October 25th. |
Conclusion, Investment Implications, Strategy
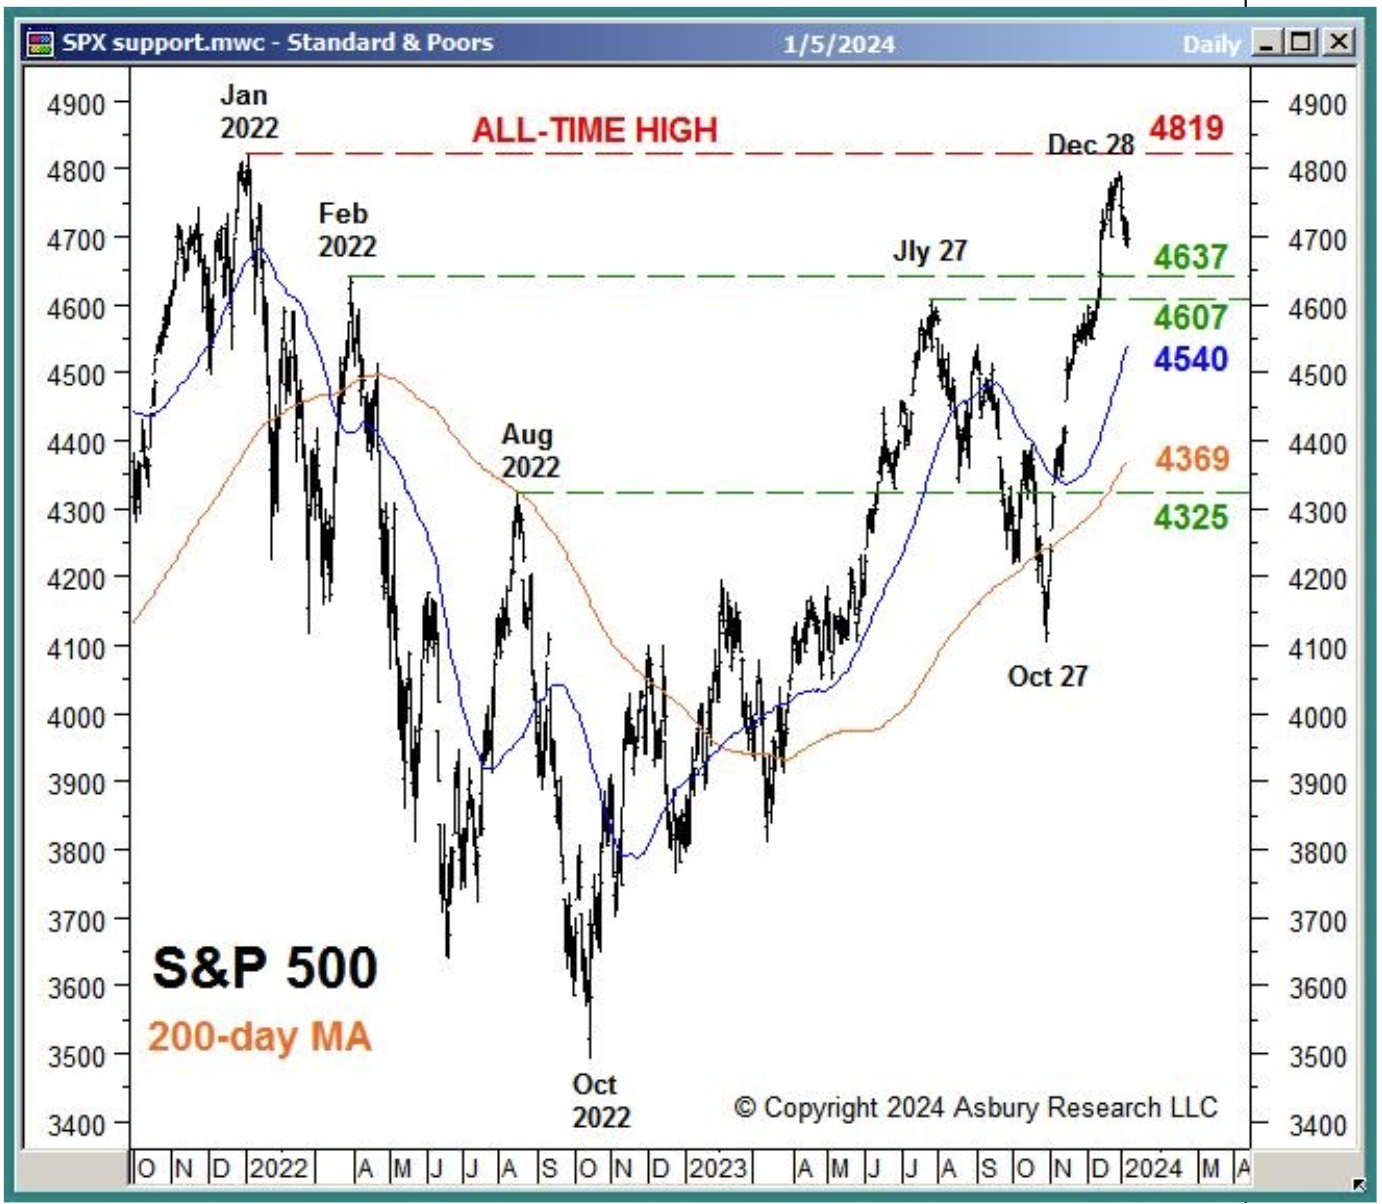
The benchmark S&P 500 (SPX) finished Friday’s session at 4697, down 73 points or 1.5% for the week. The benchmark US index is currently trading just 2.6% below its 4819 January 2022 all-time high after testing and failing to exceed this major overhead resistance level in late December. The US stock market remains exceptionally vulnerable to a corrective decline from at or near its current level. The latest ETF asset flow data indicates that a decline below SPX 4694 would put 7.0% of newly-added assets invested in the SPDR S&P 500 Trust ETF (SPY) into the red. Should this occur, it could trigger a deeper and more aggressive decline and set the stage for an additional 2.0% decline to test primary Tactical support at 4637 to 4607. Weekly Summary / Key Levels To Watch The benchmark S&P 500 (SPX) finished Friday’s session at 4697, down 73 points or 1.5% for the week. The benchmark US index is currently trading just 2.6% below its 4819 January 2022 all-time high, which is major overhead resistance. Primary Tactical support is situated 1.3% to 1.9% below the market at 4637 to 4607, which represents the February 2022 and July 2023 benchmark highs. If a corrective decline is beginning, we view this area as a conservative initial downside target. Major underlying support is 7.0% to 7.9% below the market at 4369 to 4325 and represents the 200-day MA and the August 2022 benchmark high. |
Editor’s Note: This is an excerpt from The Weekly Wrap-Up report on Saturday, January 6th , which is one of many reports that published for the subscribers of Asbury Research. To see more of The Weekly Wrap-Up report click here. |
|
|
The S&P 500 Is Particularly Vulnerable Below 4694 |
Courtesy of Asbury Research LLC |
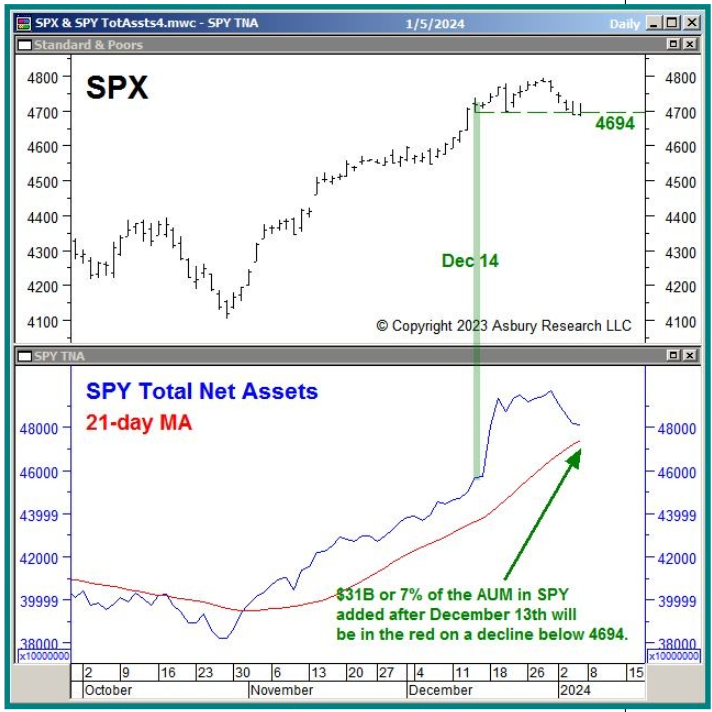
The lower panel of this chart shows that through Friday Jan 5th, the total net assets (assets under management or AUM) invested in the SPDR S&P 500 ETF Trust (SPY) expanded by $31 billion or 7.0% since Dec 14th. The green highlights in the upper panel show that the lowest price that SPX has traded since then is 4694: five times, on Dec 14th, Dec 29th, Jan 3rd, Jan 4th, and Jan 5th. This indicates 4694 is the current pressure point in the index as a decline below it would put 7.0% of the newly-added AUM in SPY into the red. And, should this occur, it could trigger a deeper and more aggressive decline. |
|
|
John Kosar, CMT was awarded the Chartered Market Technician (CMT) designation in 1999, served as Vice President of the CMT Association from 2004 to 2006, and was a member of its Board of Directors from 2002 to 2006. John began his career in 1980 on the Chicago Mercantile Exchange trading floor and spent the next 17 years there, acquiring a practical, real-world understanding of what really drives financial asset prices. John is the founder and Chief Market Strategist of Asbury Research, a Registered Investment Advisor he launched in 2005, which provides data-driven technical and quantitative investment research to professional and private investors. John can also be found on Asbury Research’s YouTube channel where he produces Asbury Research’s bi-weekly Following The Money podcast and additional investment information. |
|
|
You are receiving this newsletter because you subscribed to the Chart Advisor newsletter. If you wish to unsubscribe, please click here. Dotdash Meredith 225 Liberty St, 4th Floor, New York, NY 10281
© 2024 All Rights Reserved. Privacy Policy | Terms of Service |
|
|
|