1/ RBOB: Where’s it headed? |
|
|
Investopedia is partnering with CMT Association on this newsletter. The contents of this newsletter are for informational and educational purposes only, however, and do not constitute investing advice. The guest authors, which may sell research to investors, and may trade or hold positions in securities mentioned herein do not represent the views of CMT Association or Investopedia. Please consult a financial advisor for investment recommendations and services. |
|
|
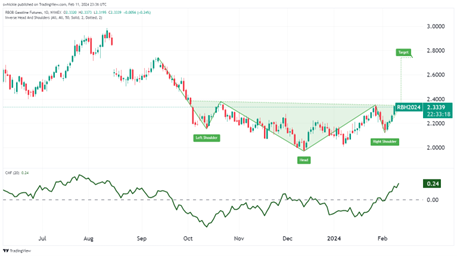
Historically, due to seasonality pressures, RBOB will generally reach its lowest levels in December and will typically reach its highest prices in April or May. This is due to refinery shutdowns as they reformulate gasoline from a winter to summer blend. Last week, gasoline inventories fell by over 3 million barrels vs an expected gain of 140,000 barrels. The world seems to still being running full speed through a geopolitical landmine field with the Ukrainian conflict, attacks on shipping lanes in the Red Sea, and reduced hopes for a ceasefire in the Israeli Palestinian conflict. Referencing the RBOB futures continuation chart, a potential bullish reversal pattern is forming known as an Inverse Head and Shoulders Pattern. Inverse Head and Shoulders Patterns are considered a measuring pattern which allows us to formulate a potential upper price target as you can see in the chart below. RBOB is flirting with a breakout above the neckline of this pattern. One consideration for a confirmed break out above the neckline, is for the move to happen on strong volume. For this I refer to the Chaikin Money Flow Line located at the bottom of the chart which is currently indicating a period of accumulation with a reading above 0. If the breakout occurs without an increase in accumulation or volume you should be skeptical of the move higher. Over the next week or two we should keep an eye on RBOB to see if we do indeed get a confirmed breakout. |
|
|
In my time trading and managing money for others I have found that there is an endless supply of indicators and magic formulas designed to tell us whether markets will rise or fall. The truth is no one really knows for certain. There is always the risk that an event occurs that no one can predict that causes prices to move in an unprecedented way. No single signal nor indicator is going to be right 100% of the time. The goal, however, is to help guide the investor to make decisions they can feel confident about. Everybody has a different toolbox of technical tricks. There are a number of that have helped me make rational decisions during wildly irrational times over the number of years. My core belief is Fundamental Analysis will help us understand where an asset should be priced at, Technical Analysis will help us understand the path it takes to get there. It is also my belief that most markets, when trending, will follow a channel or series of channels as they trend up or trend down. One easy way to determine the trend and apply upper and lower channels of a stock is to simply overlay a Linear Regression on top of the chart you are analyzing. A simple way to think of it is the line of best fit between the starting point and ending point. The slope of this line can help visually determine the trend. Adding an upper channel and lower channel between 1 and 2 standard deviations can now help us follow the trend and determine entry/exit points should the trend continue or reverse.
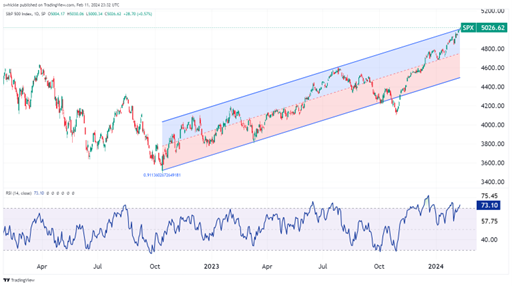
Traders will look for instruments that are trading in overbought or oversold territory relative to a longer-term trend. As prices approach upper channel, traders might consider the price level to be overbought and would look for an opportunity to sell, or, conversely as prices approach the lower channel, traders might consider the price level to be oversold and therefor look for an opportunity to buy. Looking at the trend of the S&P 500 (SPX) since the post covid low, we recognize a relatively clear upward trending market, with the SPX trading near the upper band of the channel. Given it is flirting with a high which is 2 standard deviations from the mean it may now be considered overbought. An overbought reading can be confirmed by referencing the Relative Strength Index (RSI) at the bottom of the chart, which is currently sitting at 73. A reading above 70 is considered overbought and a reading below 30 is considered oversold. Should the SPX revert to the mean, a retracement of roughly 5% over a period of time, is considered normal. |
|
|
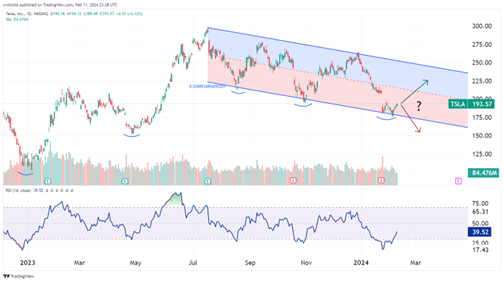
Technical Analysis isn’t always about finding a diamond in the rough. It can also be a way to help eliminate a potential portfolio pitfall. When entering a position, the single most important part of the process is not how to get into a trade, but how the heck are you going to get out? Having a pre-existing plan can save you from having a short-term trade turn into a long-term investment. Often, I will speak with a client that wants to know my opinion about a stock. Truthfully, I may not have any opinion, but the client is asking for guidance. It is my job to give them the best unbiased timely analysis I can provide. I go back to my core belief that Fundamental Analysis will help us understand where an asset should be priced at, Technical Analysis will help us understand the path it takes to get there. Over the weekend Tesla (TSLA) began offering a temporary discount on a few models which follows recent discounts in Europe and China. After a not so good quarter shares tumbled to a low of $175.01 after gapping down on high volume, post report. Earnings expectations have been reduced. Since then however, it has risen a little more than 10% off the near-term low. Using some of the tools, we have already learned about I added them to the TSLA chart. The Linear Regression Channels show TSLA is in a downward sloping trend. However, it is trading near the lower band of the regression channel. After adding the 14-day Relative Strength Index (RSI), you can see it was recently trading in oversold territory and how it responded in the past when trading in overbought territory according to the RSI. Then the question becomes does the most recent gap get filled becoming an exhaustion gap or will it become a runaway gap? Should a client insist on making a play I would review their goals and be sure to formulate a sound exit strategy regardless of how they want to trade it. There may not always be a right way to trade a given security it but there is always a wrong way and that is to not have a plan. |
|
|
Seth Hickle, CMT is a Chartered Market Technician (CMT) who’s passion for the markets led him to discover the power of technical analysis. His core investment belief is fundamental analysis will help us understand where an asset should be priced, technical analysis will help us understand the path it takes to get there. Seth is a Derivatives Portfolio Manager for Innovative Portfolios and sister company Sheaff Brock Investment Advisors where he manages derivative based strategies with a focus on harvesting volatility risk premium. |
|
|
You are receiving this newsletter because you subscribed to the Chart Advisor newsletter. If you wish to unsubscribe, please click here. Dotdash Meredith 225 Liberty St, 4th Floor, New York, NY 10281
© 2024 All Rights Reserved. Privacy Policy | Terms of Service |
|
|
|