By Ryan Gorman, CFA, CMT, BFA |
|
|
Investopedia is partnering with CMT Association on this newsletter. The contents of this newsletter are for informational and educational purposes only, however, and do not constitute investing advice. The guest authors, which may sell research to investors, and may trade or hold positions in securities mentioned herein do not represent the views of CMT Association or Investopedia. Please consult a financial advisor for investment recommendations and services. |
|
|
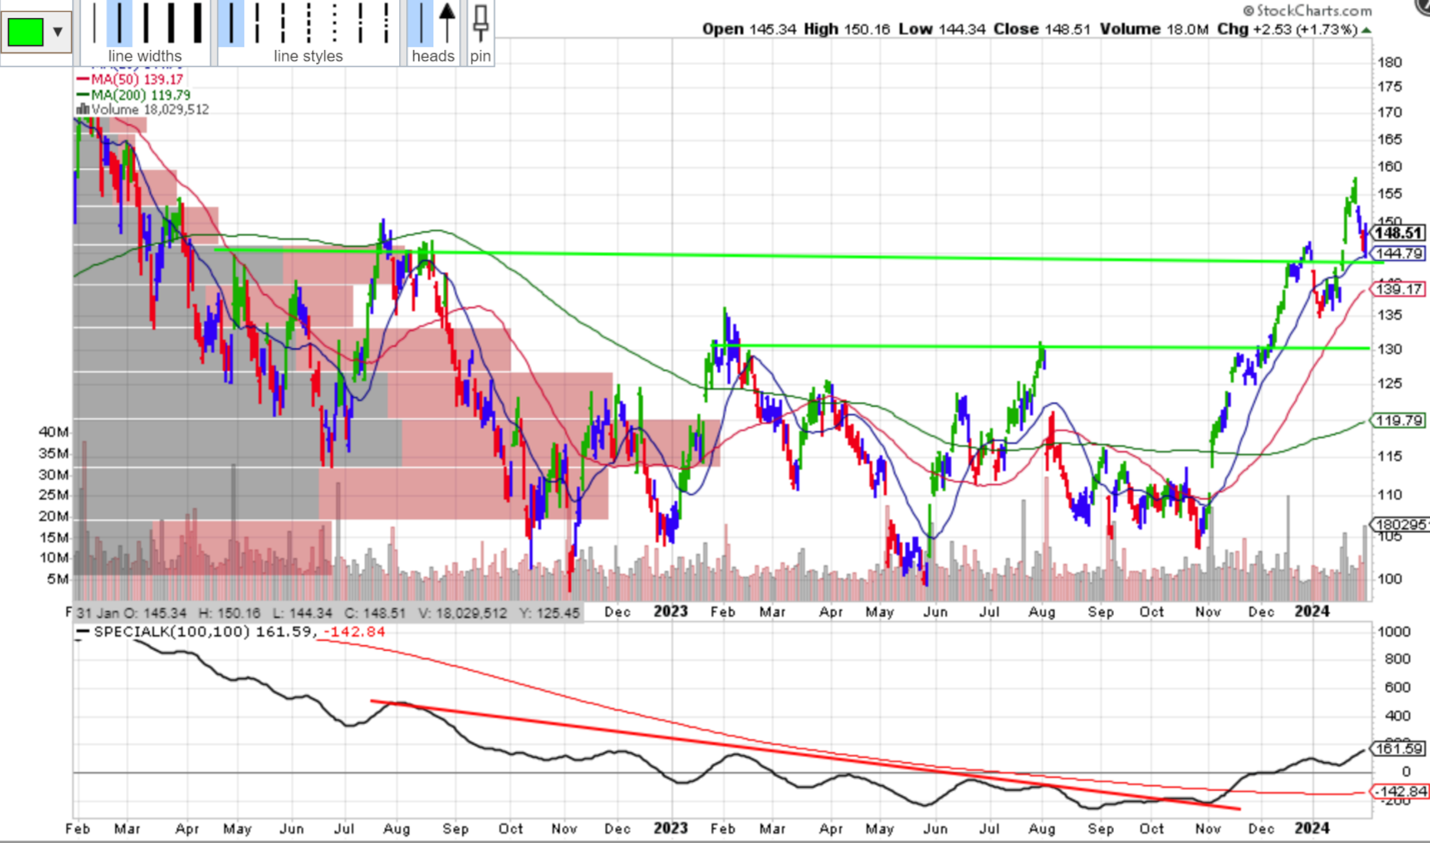
Market action on Wednesday was driven by some large tech earnings (think GOOGL and AMD) and later a fed that does not look eager to cut rates in March. However, QCOM bucked that trend, closing up over 1%. After a failed breakout in December, there was a solid breakout in January that has tested support along with the 20-day moving average. Elder bar is still blue, but after hours the stock was up another 2%. If that carries over, I would expect this to change. |
Courtesy of StockCharts.com |
After being largely range bound all 2023, something changed with the Pring special K indicator. This is a very long-term momentum indicator that in this case broke the downtrend and offered some favorable evidence that an upside breakout could occur. Read more here: Martin Pring's Special K [ChartSchool] (stockcharts.com) |
|
|
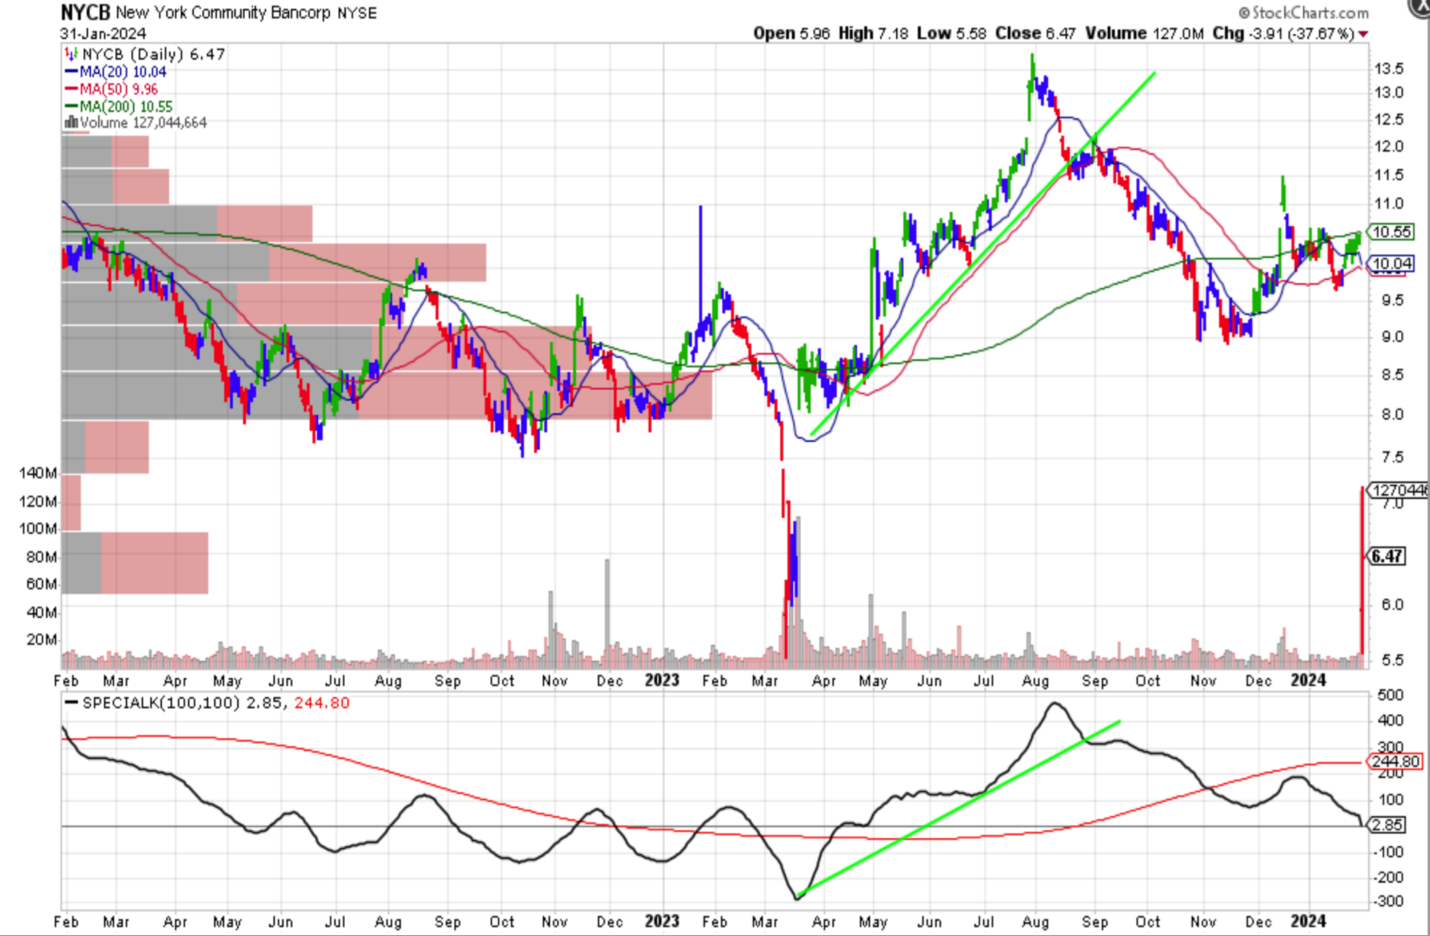
After a few regional banks failed last March, the Federal Reserve set up a facility to shore up liquidity. Many regional banks have gone to previous and even new highs. One that struggled today was New York Community Bancorp. They announced an unexpected loss on an increase to loan loss provisions up to $550 or so million. About 10 times what the street was expecting, they even cut their dividend. This caused a quick move back to the March lows. |
Courtesy of StockCharts.com |
After a strong recovery from the March low, the Special K broke its downtrend. Largely NYCB remained stagnant until today. No indicator is perfect, investing and trading is a lot about probabilities. Whatever your investment philosophy, Trend, Value, etc, it pays to stick to your rules. Even if a stock you don’t own goes up, better to be consistent. |
|
|
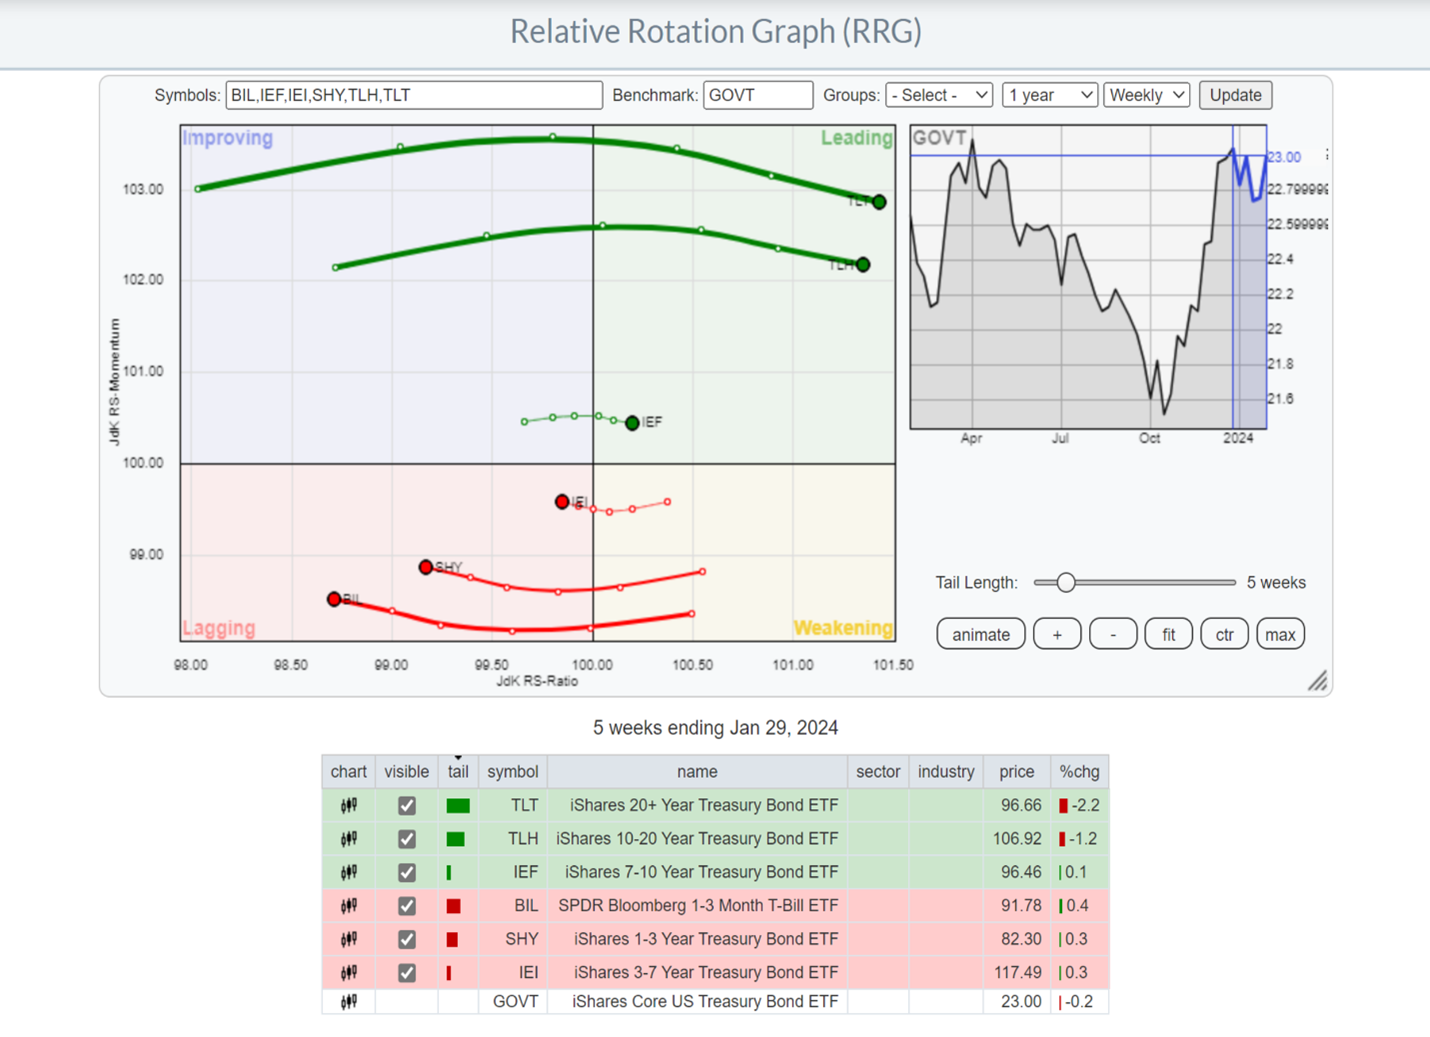
The federal reserve held the Fed Funds rate steady today between 5.25-5.5%. The longer part of the curve remains below this, a so call inverted yield curve. In fact the 10 year went back under 4% today. Historically the yield curve has been a solid predictor of recessions. Something has to get the short end back below the long end. Much of the rally in stocks could be attributed to Powell’s speech in fall where he indicated hiking was done and the next move was likely a cut. The fed’s internal forecast was for 3 cuts. There is no rule on the magnitude, but it is often in 0.25% increments, so 0.75%. |
Courtesy of StockCharts.com |
The momentum seems to still favor a rally in longer term bonds. When bond prices rise, yields fall. The market continues to believe the fed may be forced more aggressively. |
|
|
Ryan Gorman, CFA, CMT, BFA is a Chartered Financial Analyst (CFA) and Chartered Market Technician (CMT) dual chartered holder. In addition, he holds the Behavioral Financial Advisor designation, he is fascinated by the impact of human behavior on their financial planning as well as on markets. Ryan serves as a Financial Advisor and Chief Investment Officer focusing on the management of portfolios for retail clients. |
|
|
You are receiving this newsletter because you subscribed to the Chart Advisor newsletter. If you wish to unsubscribe, please click here. Dotdash Meredith 225 Liberty St, 4th Floor, New York, NY 10281
© 2024 All Rights Reserved. Privacy Policy | Terms of Service |
|
|
|