1/ Strong and Positive Consolidation in the Energy Space |
2/ RRG, Relative Strength, and More |
3/ Exxon Mobil Corp (XOM) |
4/ Valero Energy Corp (VLO) |
|
|
Investopedia is partnering with CMT Association on this newsletter. The contents of this newsletter are for informational and educational purposes only, however, and do not constitute investing advice. The guest authors, which may sell research to investors, and may trade or hold positions in securities mentioned herein do not represent the views of CMT Association or Investopedia. Please consult a financial advisor for investment recommendations and services. |
|
|
Strong and Positive Consolidation in the Energy Space |
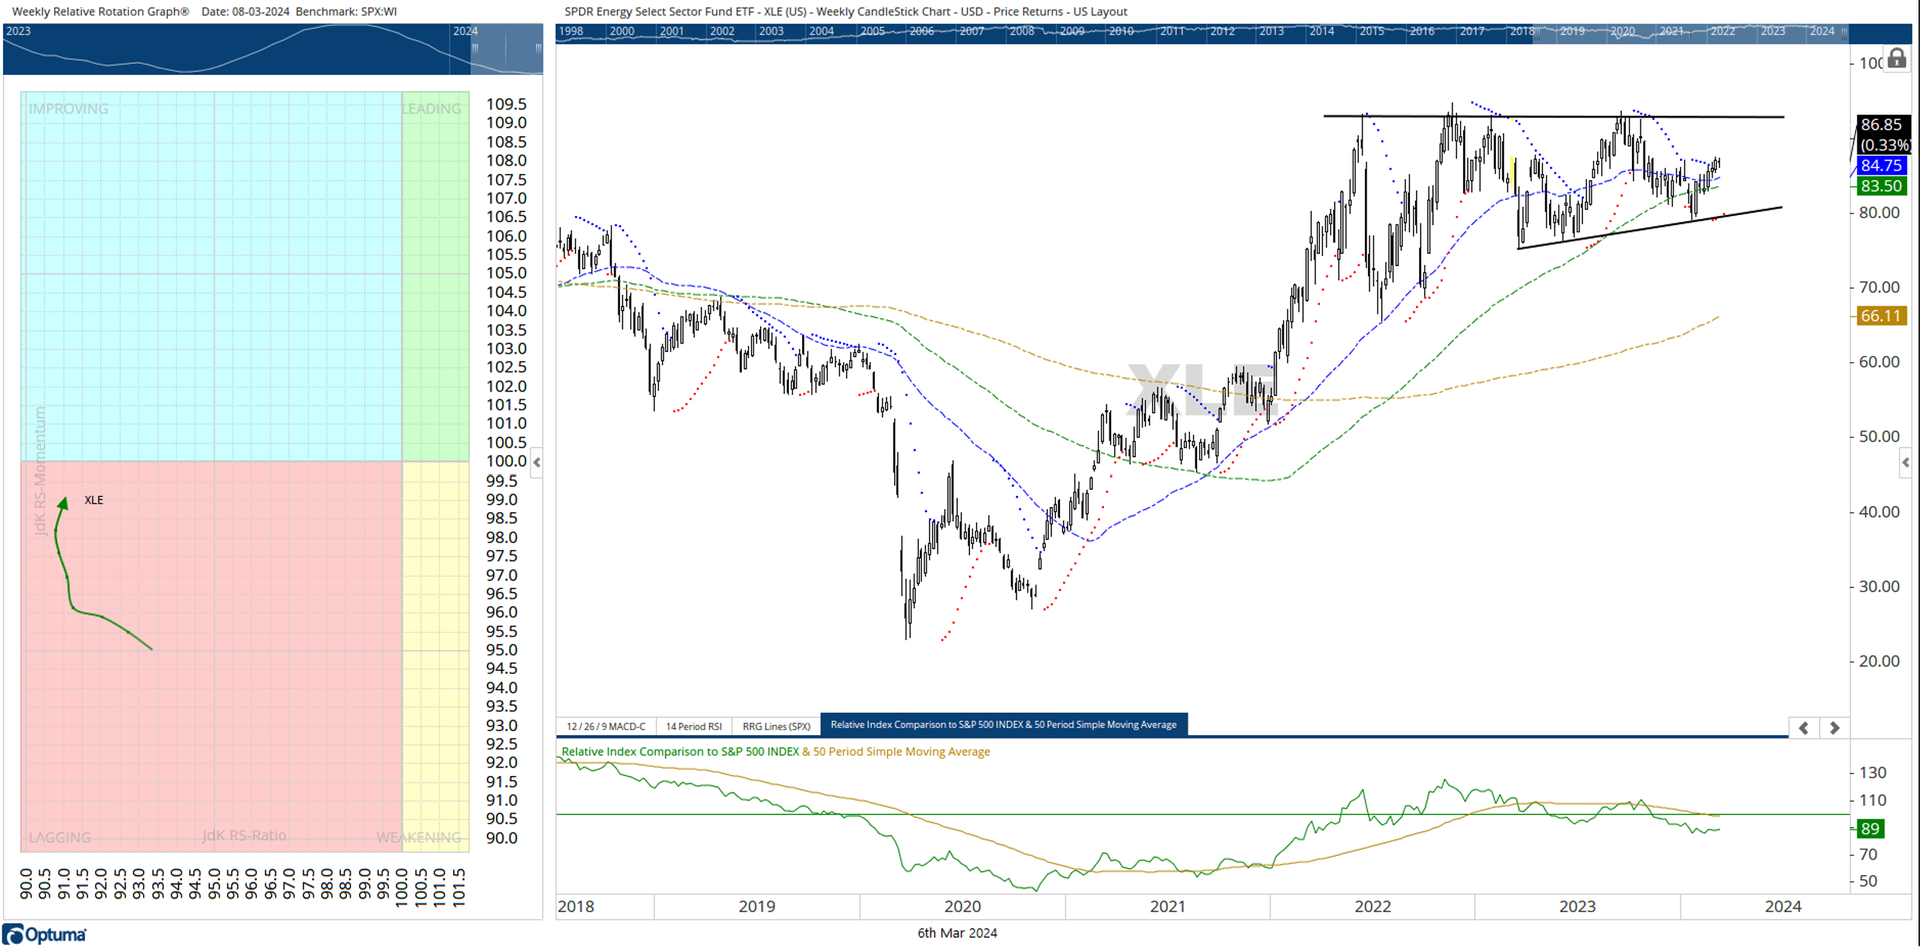
A relative underperformance is observed in the Energy space over the past year. Examination of the Relative Strength (RS) line of SPDR Energy Select Sector Fund ETF (XLE) is currently in a downtrend as evident from the lower pane of the above chart. Looking it closely reveals that the relative performance started to give up from January 2023; it continues to remain in a downtrend. However, over the past few weeks, while staying inside the lagging quadrant of the RRG, this space has been showing a strong improvement in its relative momentum against the broader S&P 500 index. Its rolling inside the improving quadrant would mean a potential beginning of its phase of relative outperformance against the benchmark. Currently, XLE is seen in a broad consolidation following multiple tests of 93 – 93.50 levels over the past several quarters. |
|
|
RRG, Relative Strength, and More |
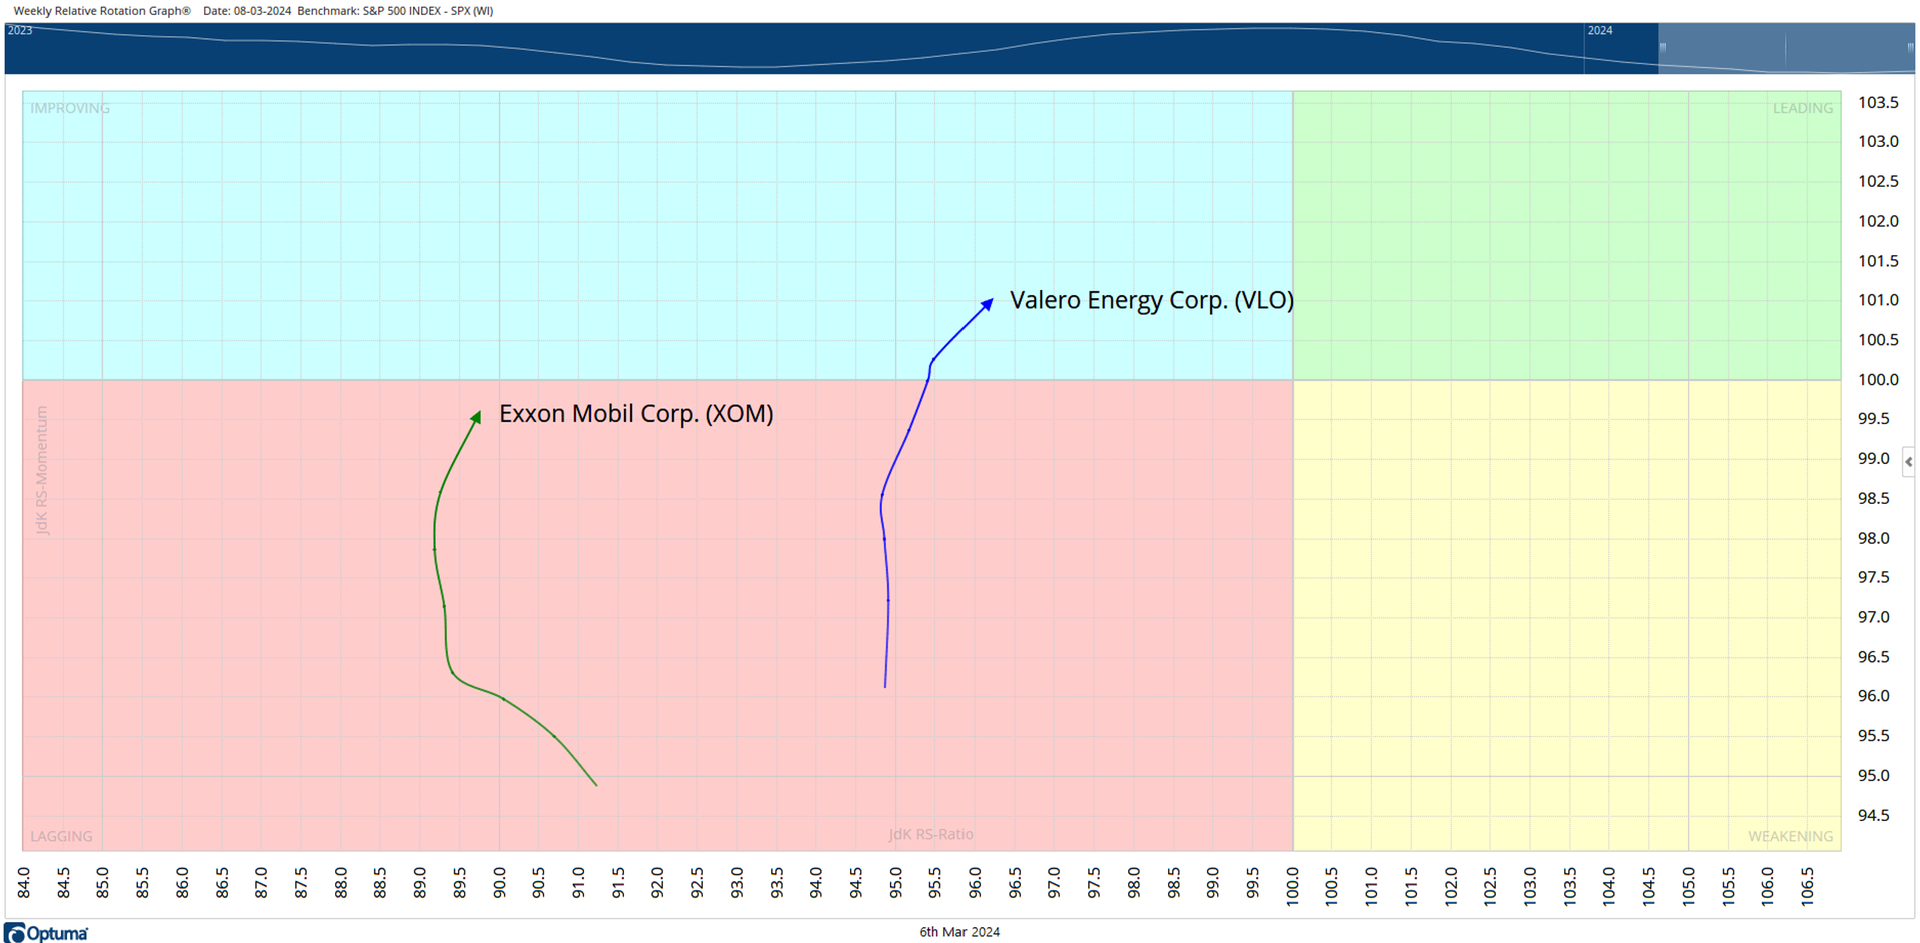
The presence of Relative Strength in any instrument is of paramount importance for any portfolio. If the RS is strong or if it has started to improve, it will have two very obvious benefits. First, a holding with a strong or improving Relative Strength is largely expected to end up generating alpha over the benchmark when the markets are trending higher. The second benefit, which I believe is equally necessary, is that when the times are choppy and the markets are in a phase of corrective retracements, the holding with better Relative Strength ends up lending resilience to the portfolio. Within the Energy space, Exxon Mobil Corp. (XOM) and Valero Energy Corp. (VLO) are showing sharp improvements in their relative momentum against the broader markets. While XOM is rolling toward the Improving Quadrant, VLO has seen its Relative Momentum already crossing above 100 as it has rolled inside the Improving Quadrant. With XOM particularly more distant from the center point, it is expected to generate a higher alpha. |
|
|
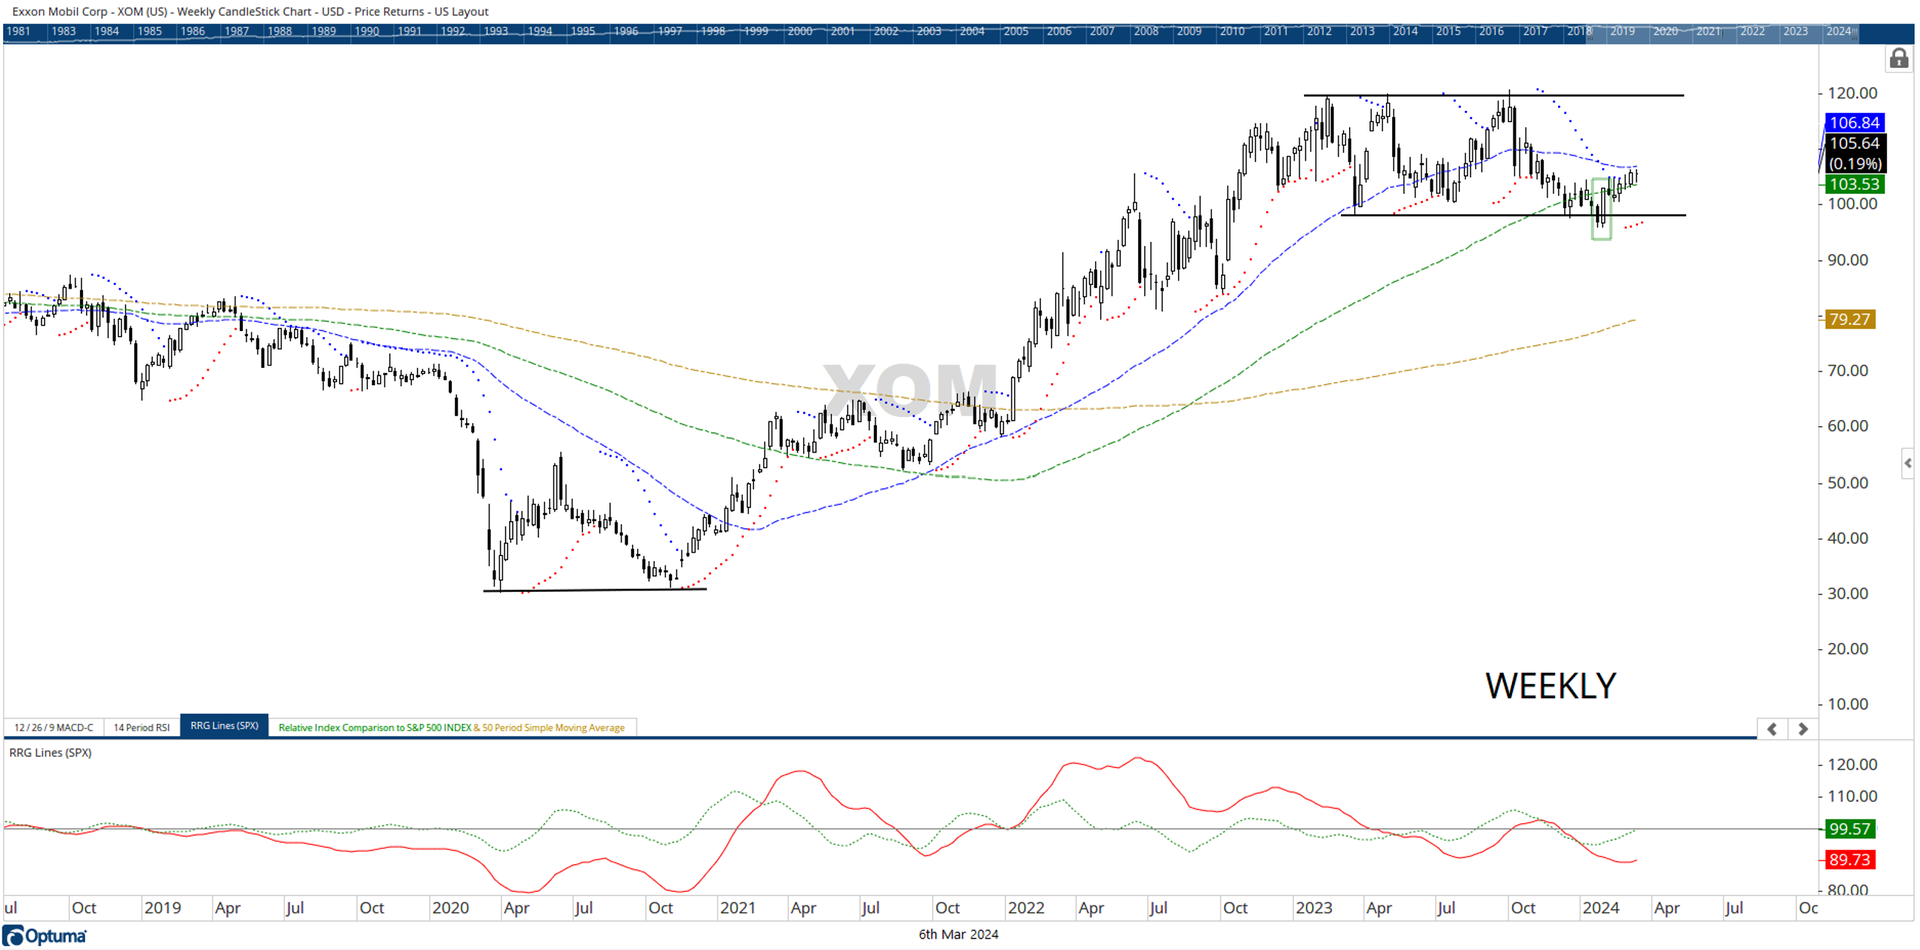
After forming a classical double bottom support in October 2020, XOM has remained largely in an uptrend. The stock formed its high of 119.63 in February last year after which it has been consolidating in a sideways trajectory. After February 2023, the high point was tested twice each time in April and September 2023, but the stock stayed in a trading range failing to achieve any breakout. A few signs have emerged that hint at a likely resumption of the upmove toward the high point. The occurrence of a large bullish candle near multiple pattern support lays the ground for a potential reversal of the trend. The stock has managed to cross above the 100-week MA placed at 103.53. This stock enjoys the highest holding by the ETF. A retest of the previous high could mean a potential appreciation of over 13% from the current levels. |
|
|
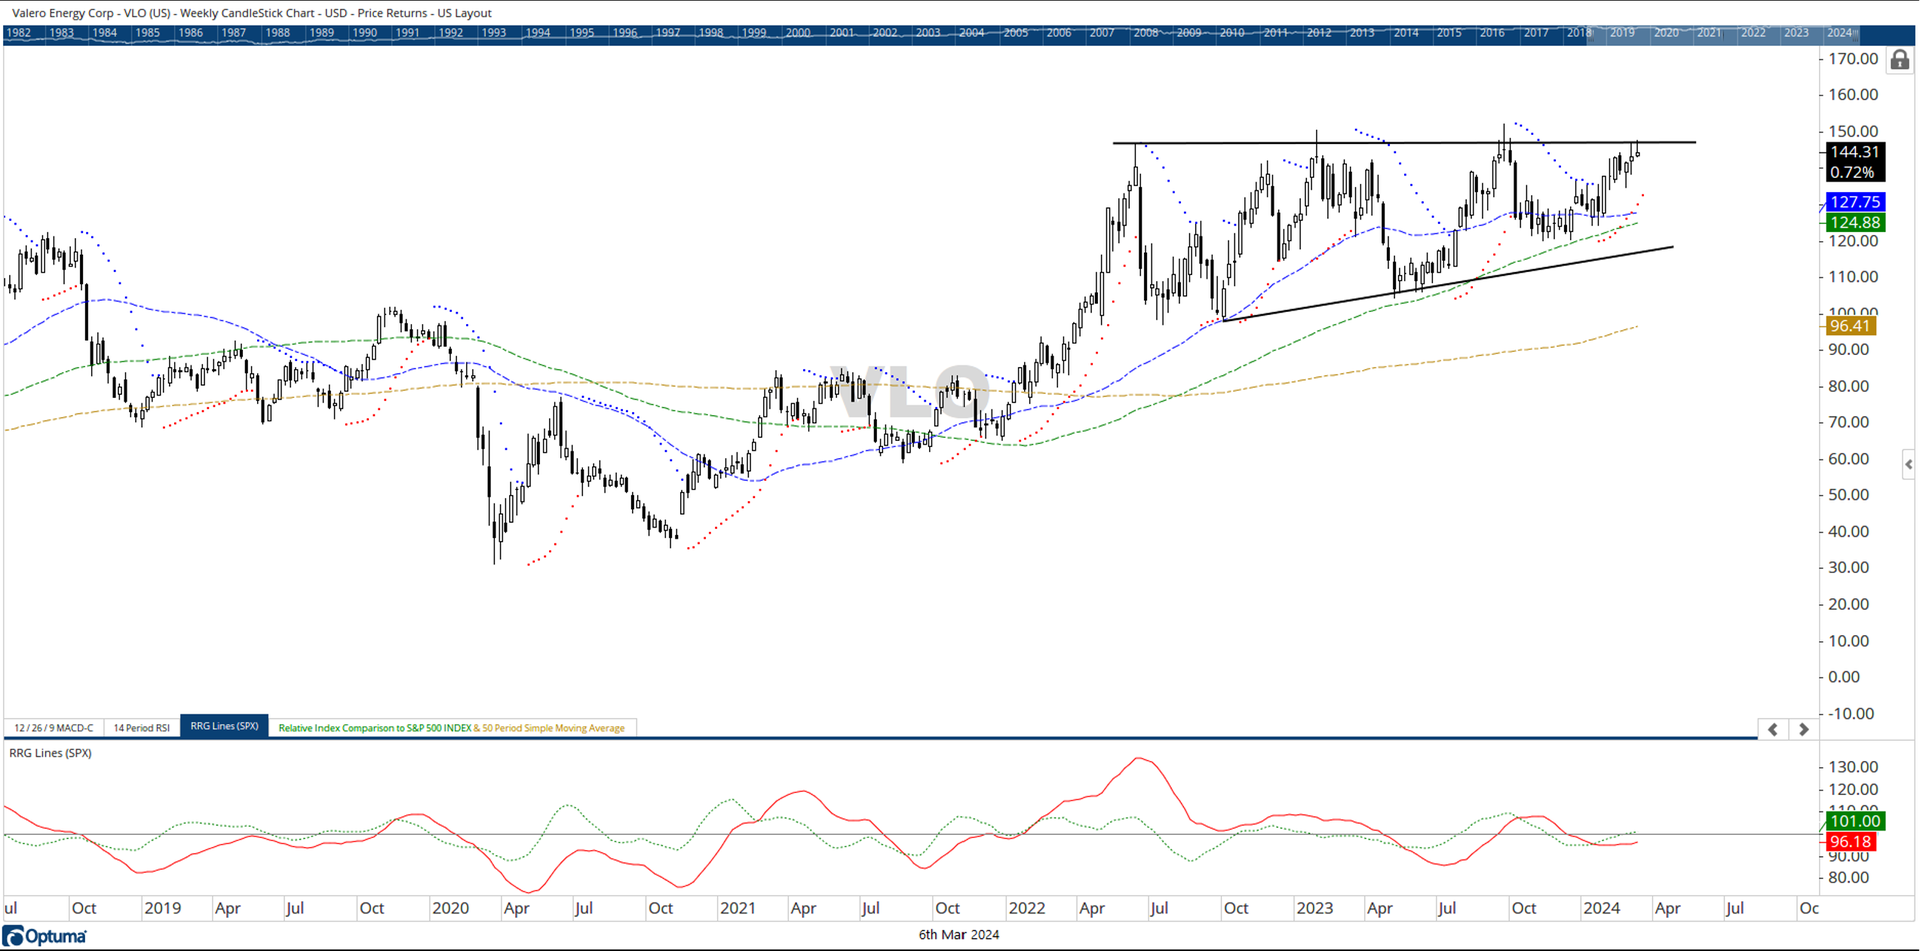
VLO tested its high in June 2022; after testing the levels of 146.80, the uptrend was halted. The price action over the past many quarters since then has led to the emergence of a bullish ascending triangle. The Relative Strength of the stock is seen improving. The RS line against the broader S&P 500 Index is seen inching higher after forming higher bottoms and is set to cross above the 50-period MA. While MACD stays bullish and above the signal line, RSI shows a mild bullish divergence against the price. The stock has already rolled inside the improving quadrant of the RRG; it is likely to post resilient performance over the coming weeks. Going by the classical price measurement implications, the stock may show a meaningful upside from current levels if the anticipated breakout takes place. If that happens, the testing of the levels of 165-172 may not be ruled out. Any close below 122 shall negate this technical setup. |
| |
You are receiving this newsletter because you subscribed to the Chart Advisor newsletter. If you wish to unsubscribe, please click here. Dotdash Meredith 225 Liberty St, 4th Floor, New York, NY 10281
© 2024 All Rights Reserved. Privacy Policy | Terms of Service |
|
|
|