1/ Nikkei 225 - Giant Base Breakout |
2/ DAX 40 Making New All-Time Highs |
3/ Dow Twins are at it Again |
|
|
Investopedia is partnering with CMT Association on this newsletter. The contents of this newsletter are for informational and educational purposes only, however, and do not constitute investing advice. The guest authors, which may sell research to investors, and may trade or hold positions in securities mentioned herein do not represent the views of CMT Association or Investopedia. Please consult a financial advisor for investment recommendations and services. |
|
|
Nikkei 225 - Giant Base Breakout |
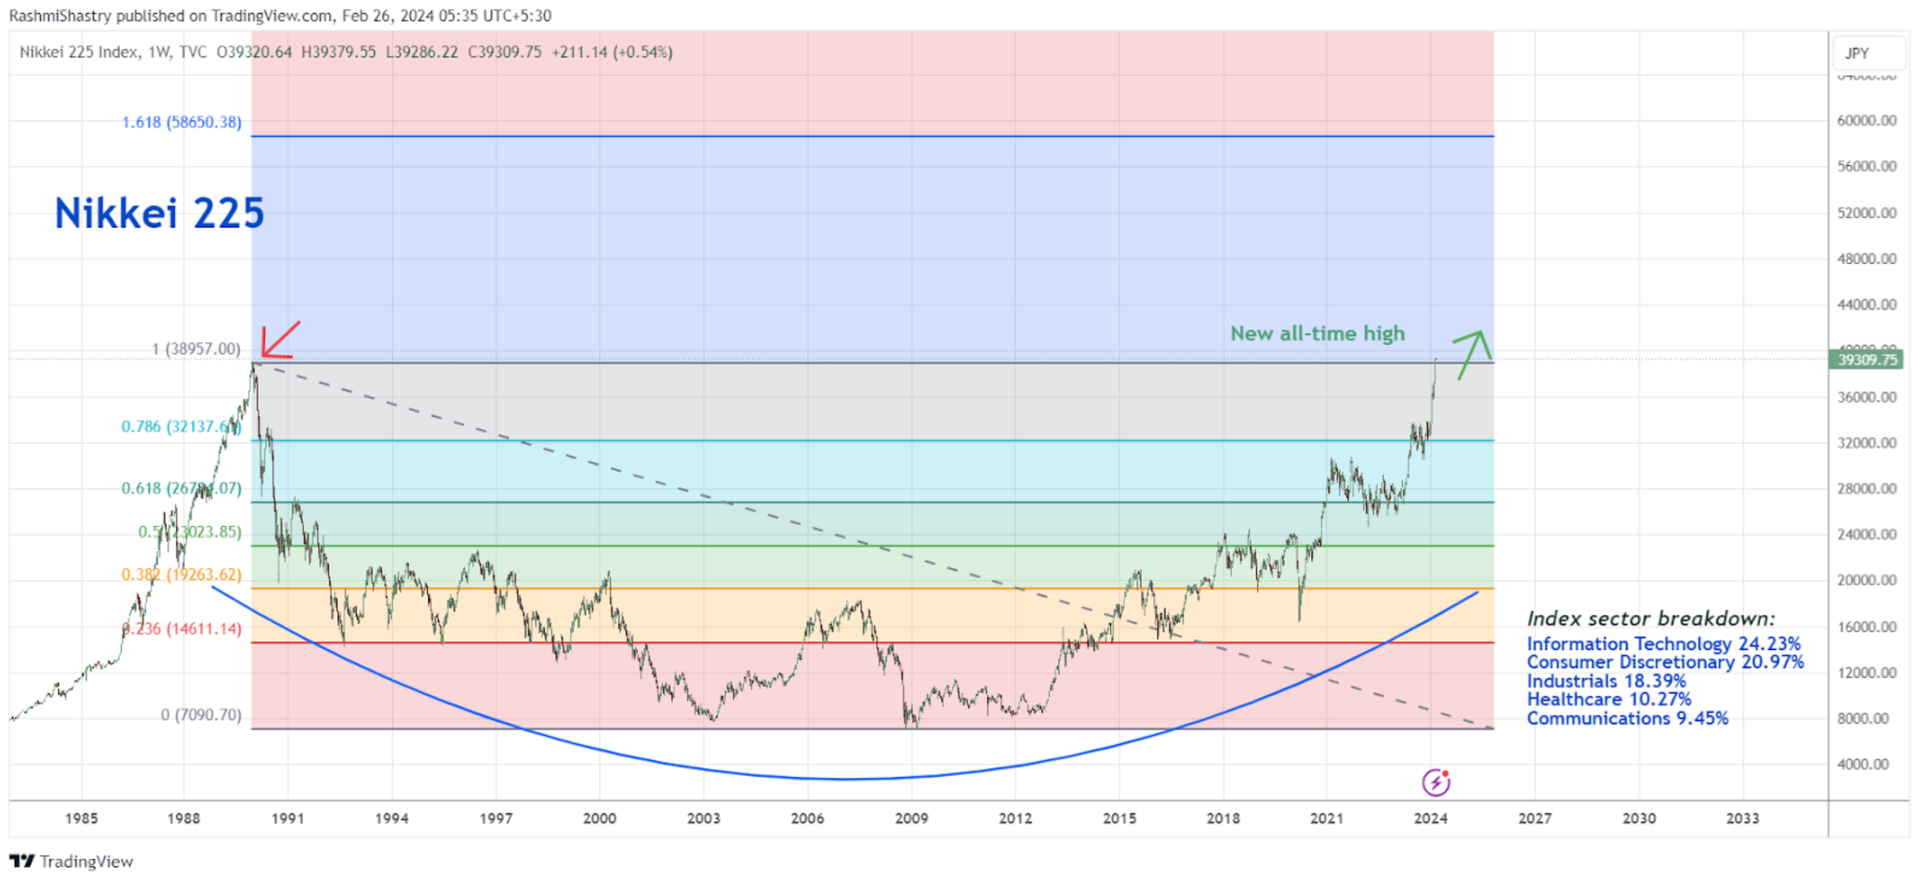
For as long as I have been a part of the market, Nikkei 225 has been under the kind of overhead resistance that makes people wonder if they will see a breakout in their time. As you spend more time in the market, you learn to be less dramatic than that! Over the years I have learned to keep my charts simple and clean. I have decluttered numerous indicators (that would typically give me similar information) and made price the hero of my story. I begin by looking at the global indices on a weekly basis as I track movements based on new price highs. The chart that leaped off the page this time around was Nikkei 225. Japan has been forming a massive base over the past 34 years. Yes, you read that right, 34 YEARS!! Well, the bigger the base, the higher in space! Whatis interesting about the Nikkei 225 is that it is a price-weighted index and not a market capitalization index. This means that the highest priced stock will carry the most weight. As for the next information I track, I get into the sector breakdown of the index. This gives me further perspective about the industries leading the move that I am tracking. As can be seen, the top three sectors in the Nikkei 225 are Information Technology, Consumer Discretionary and Industrials. This is where I do a deep dive into the sectors. From a target perspective, I use the Fibonacci extensions to arrive at the probable levels of resistance or support. With the price maintaining its position above the breakout level of 38,957, the next level to watch out for would be close to 58,650. Yes, that seems like a steep target. But we already went over the big base and high space concept, so I’m not going to do that again. |
|
|
DAX 40 Making New All-Time Highs |
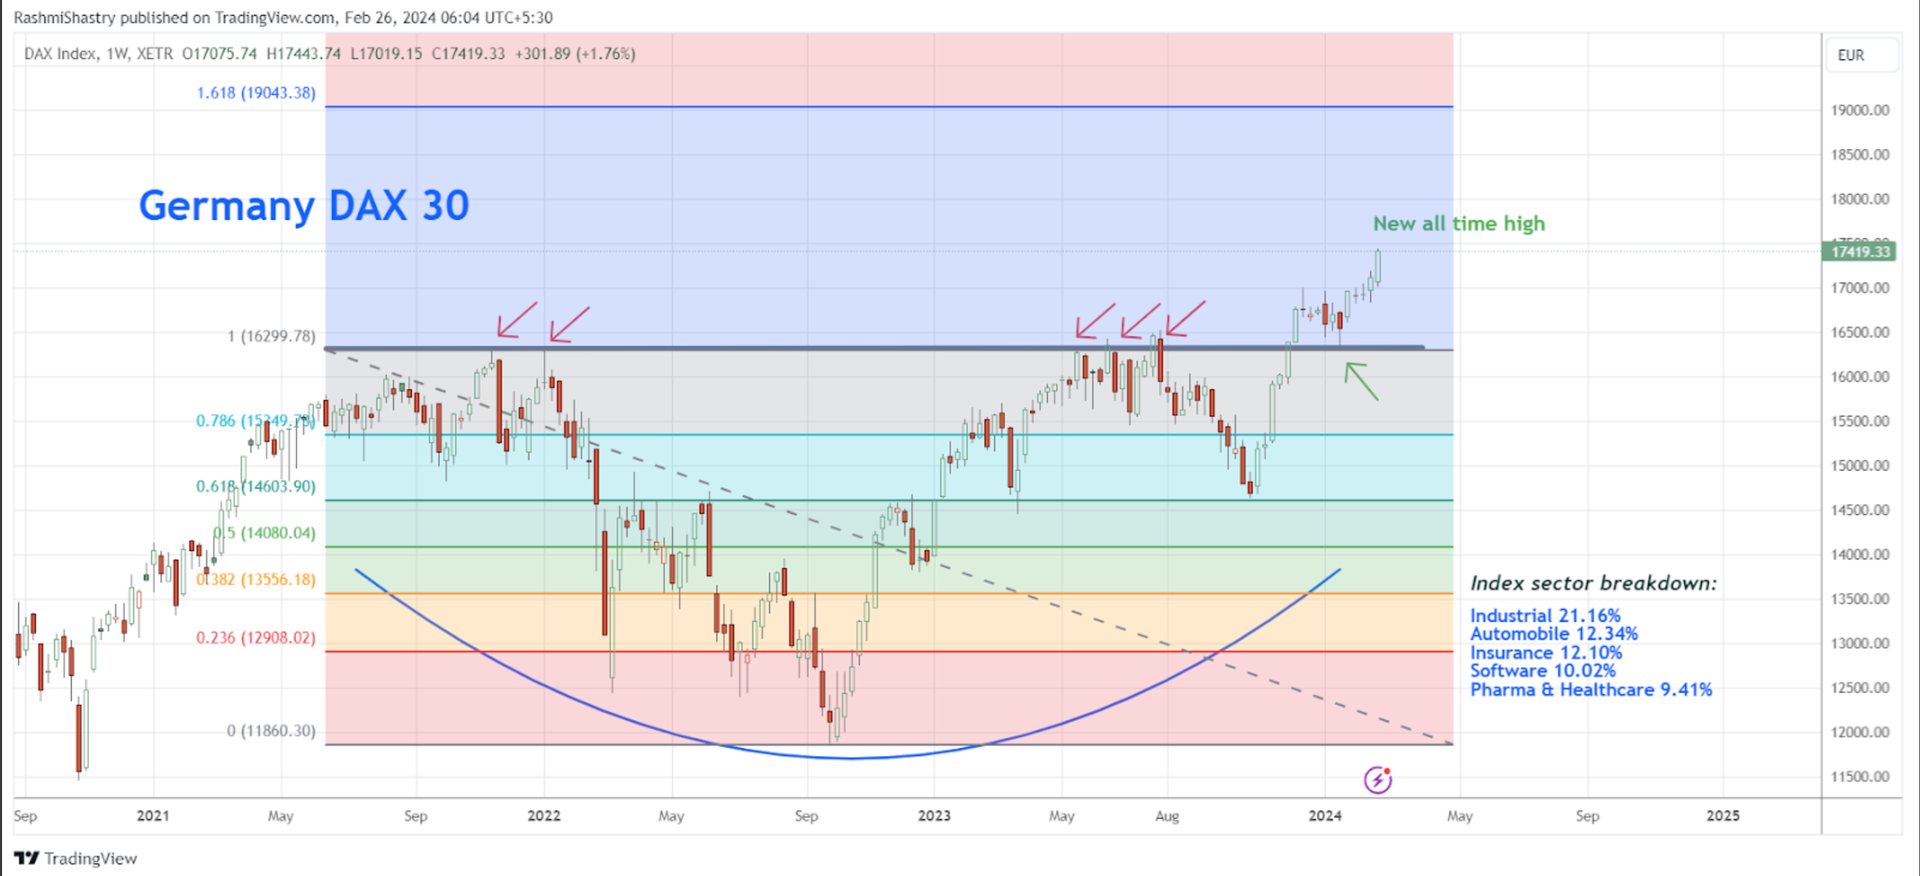
DAX 40 has joined the party of new all-time highs observed at the index level. As can be seen in the chart, the index has been consolidating in a sideways pattern for close to four years. During this time, price has made multiple attempts to get past the breakout level of 16,300. There have been five failed attempts that resulted in the continuation of the sideways trend. As we know, the more times a level is tested, the more likely it is to break out! So in late December 2023, we saw a breakout come through, following which in text book pattern style, the price retraced taking support of the breakout level and continuing on to making new highs. Another aspect to notice is that the resistance level lined up with the fibonacci retracement level, reinstating the importance of 16,300. When multiple indicators allude to the same level, the investor grows more confident of that zone. As for the targets I’m tracking, as long as DAX 40 remains above 16,300, the next level to watch out for would be 19,045. |
|
|
Dow Twins are at it Again |
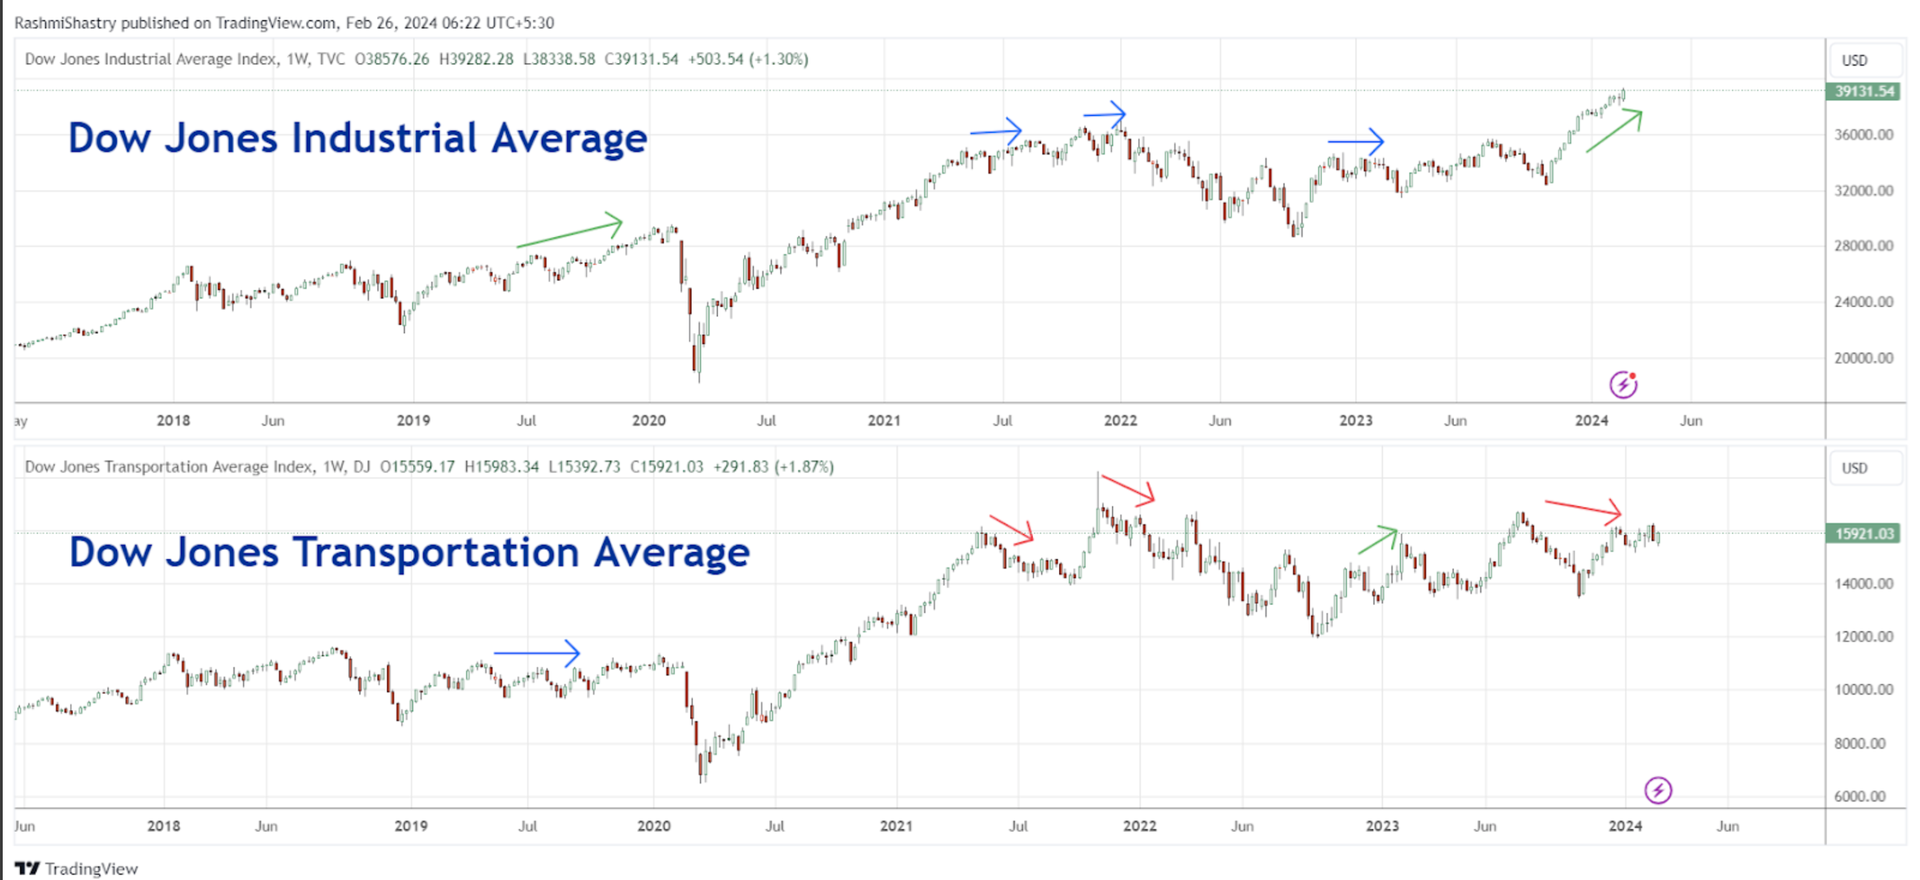
Charles Dow gave us technicians one of the most important indicators we could hope for- The Dow Theory! The Dow Jones Industrial and Dow JonesTransportation Averages. The logic being that the market was run by two main factors. One that produced the goods, the other that transported those goods. The Dow Twins made their way to every technician's academic preparation, but sometimes got ignored in the face of fancy new indicators. This simple theory states that the market direction can be confirmed when both the indices move in the same direction. And in a scenario where both the indices are moving in different directions, the analyst should grow cautious and be nimble. As can be seen in the chart in mid-2019, the DJIA was making higher highs, whereas the Transportation Average was struggling to move sideways. Of course, we all know what followed in early 2020. Similarly, these trends can be seen in short term charts as well. As marked on the chart, the Dow twins have decoupled, giving us signals of a change in trend. With the most recent move, the Industrial average is making higher highs whereas the transportation average is making lower highs. Now this information, while extremely important, must be taken in the context of all other indicators out together. I have learned over time that however small a divergence, digging a little deeper always helps understand the market better. |
|
|
Rashmi Bhatnagar, CMT is a Market Technician at All Star Charts India. Previously, she was an Equity Research Analyst at Enrich Investments in Hyderabad, India. She received her charter in February 2020 and has been a part of the financial markets since 2016. |
|
|
You are receiving this newsletter because you subscribed to the Chart Advisor newsletter. If you wish to unsubscribe, please click here. Dotdash Meredith 225 Liberty St, 4th Floor, New York, NY 10281
© 2024 All Rights Reserved. Privacy Policy | Terms of Service |
|
|
|