1/ Value Index Peeking Out of Burrow |
2/ Materials Make a 2-year High |
3/ Healthcare Poised for Greater Gains |
5/ JP Morgan Holding Down the Fort |
|
|
Investopedia is partnering with CMT Association on this newsletter. The contents of this newsletter are for informational and educational purposes only, however, and do not constitute investing advice. The guest authors, which may sell research to investors, and may trade or hold positions in securities mentioned herein do not represent the views of CMT Association or Investopedia. Please consult a financial advisor for investment recommendations and services. |
|
|
Value Index Peeking Out of Burrow |
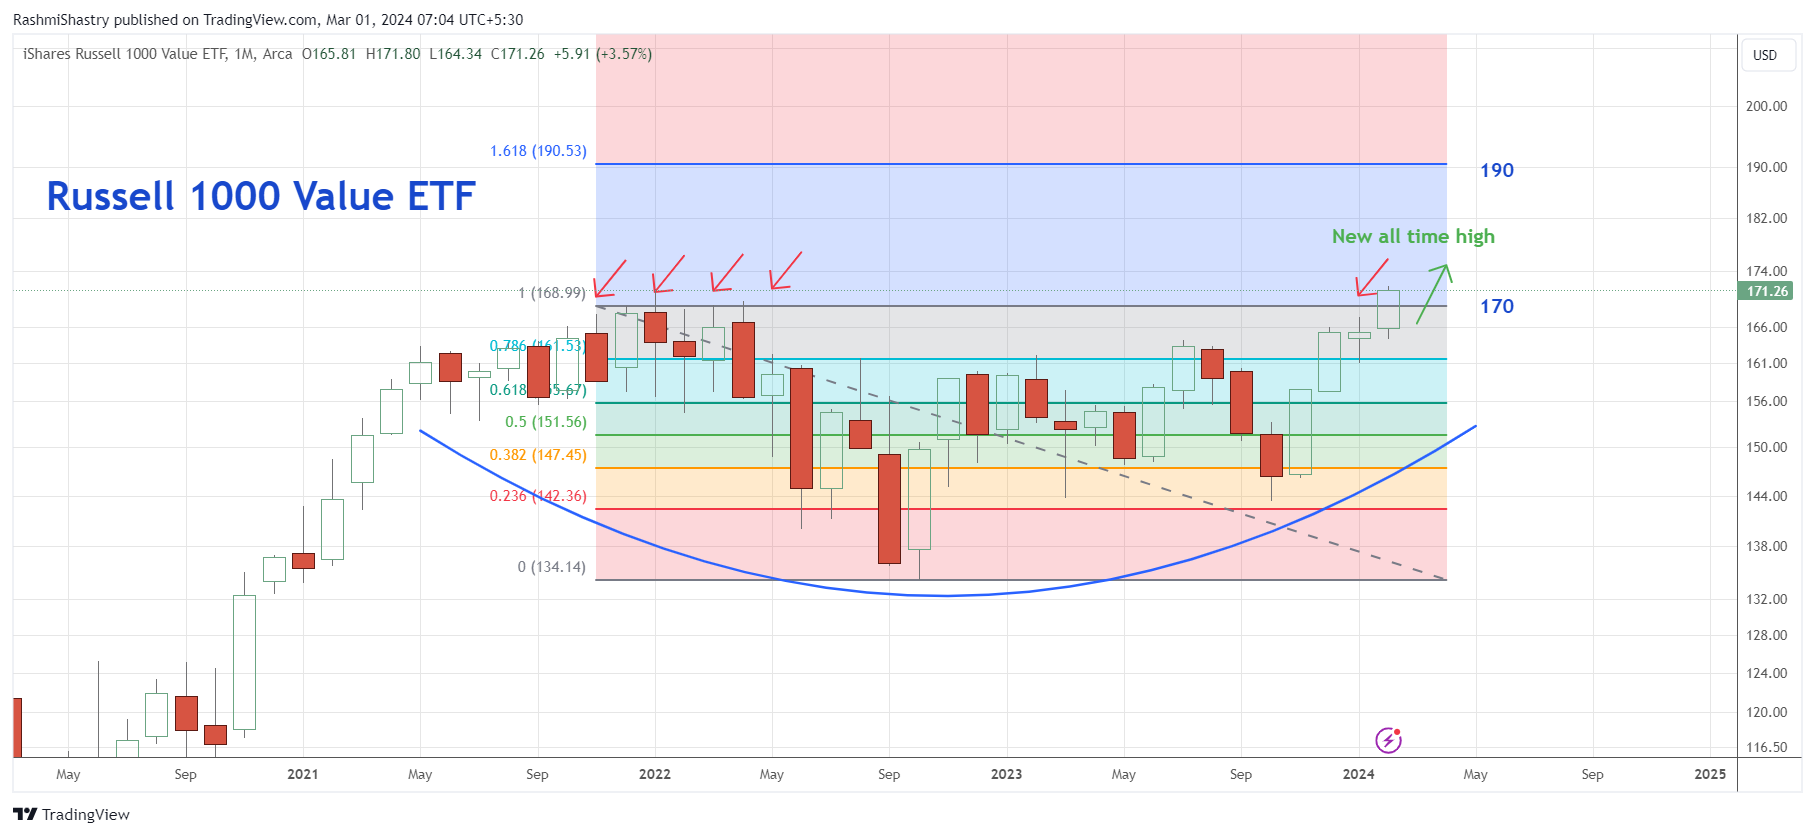
Analyzing the market involves going through multiple charts to identify strength or weakness indices, sectors, market capitalization, category, sub-category and so on. One chart that is among the list mentioned is the Growth vs Value ratio chart. Regardless of time horizon, risk profile, goals, and style, one must be aware of WHAT is moving the market. Although the Growth is absolutely crushing Value at the moment and making new monthly all time high (you’ll have to take a look at IWF/IWD on your portal), the Russell 1000 Value ETF seems to be attempting to get out of hibernation. The index has broken out of its sideways consolidation of over two years and closed above the overhead supply zone of 170, on the monthly chart. For that matter value stocks like Berkshire Hathaway, JP Morgan Chase have been doing great! Growth areas such as Tech on the other hand, have certainly weakened. Value sectors typically tend to be financials, industrials, materials, energy. And there are some very good examples of strong bullish trends in these sectors. If this breakout holds its ground, the IWD could be headed to the next resistance zone of 190, but it's crucial that the price trade above the 170 for that to play out. |
|
|
Materials Make a 2-year High |
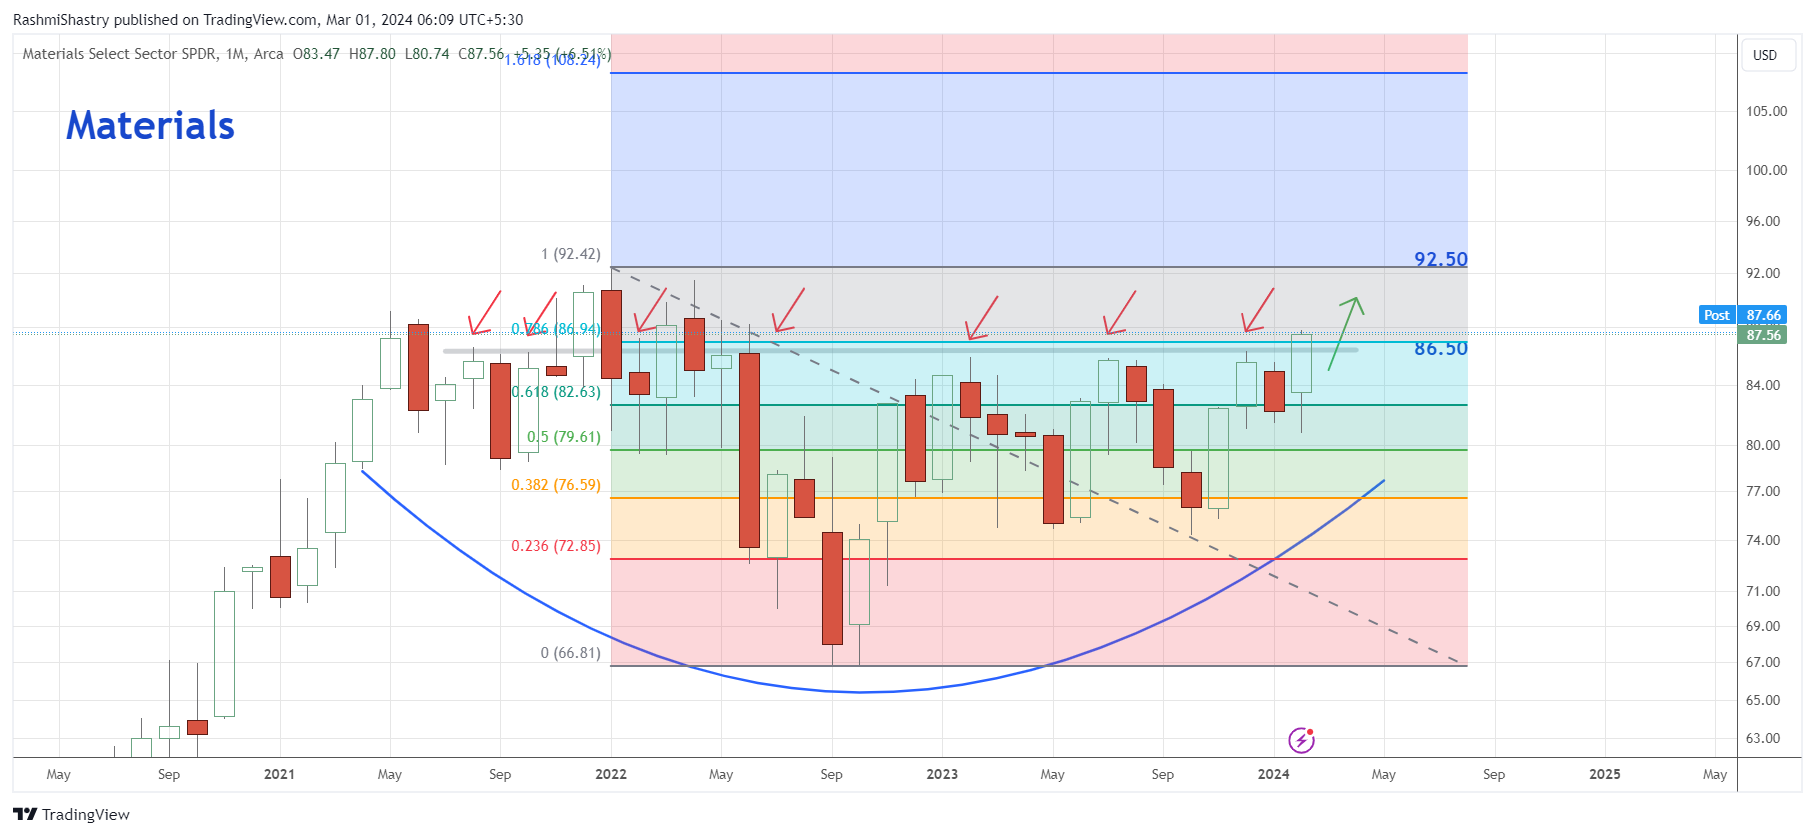
XLB is the Materials sector that is now breaking out of a close to three-year base of a sideways trend. As can be seen in the chart, multiple attempts were made to break above the supply/resistance zone of 86.50, with two false breakouts. Monthly charts give us a good perspective of the price move by leaving the noise out. We can see that since May 2022 the price hasn’t been able to break past the breakout level, let alone cross it. Incidentally, Materials has been the biggest gainer this week with 1.44% and the third biggest gainer this month with 5.60%. It is imperative for the price to hold above 86.50, not just from the breakout perspective but also from the perspective of absorbing all the supply available at this level. History is evidence that the price has found it difficult to stay above this level consistently. But if it does, the next resistance to track will come in at 92.50. |
|
|
Healthcare Poised for Greater Gains |
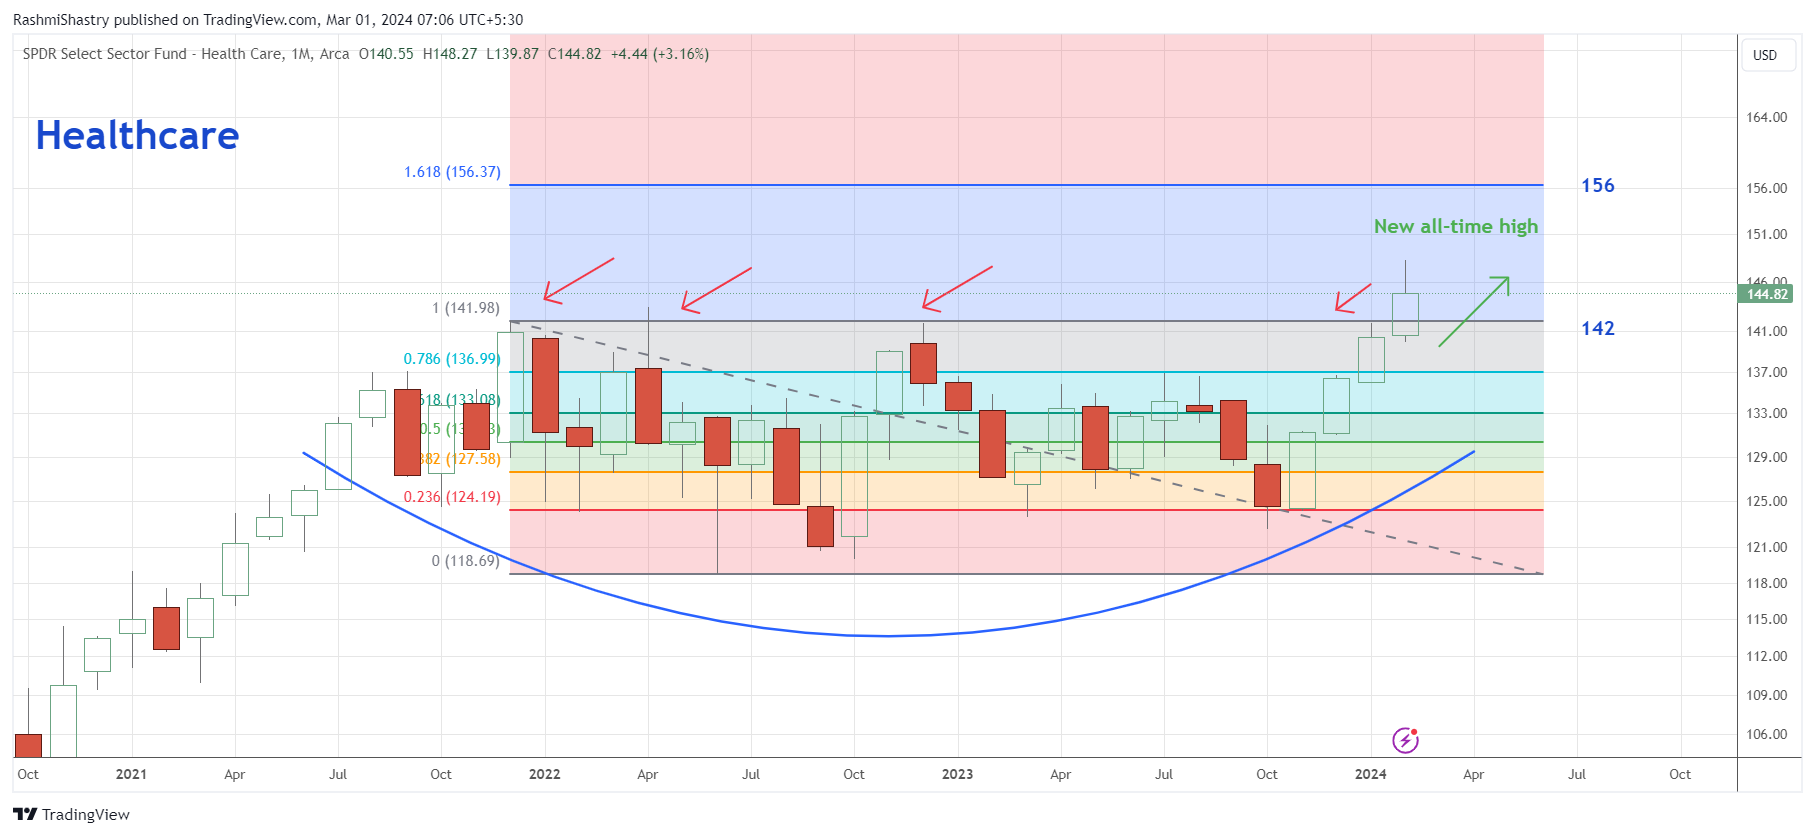
We have been speaking of the strength coming through in Healthcare and Biotechnology. We now have a confirmation of the same on the monthly chart. The price has closed above the resistance zone of 142, opening up to the next level of target close to 156. With more participation coming through from sub sectors within this sector, it will be interesting to see which group takes the price forward. |
|
|
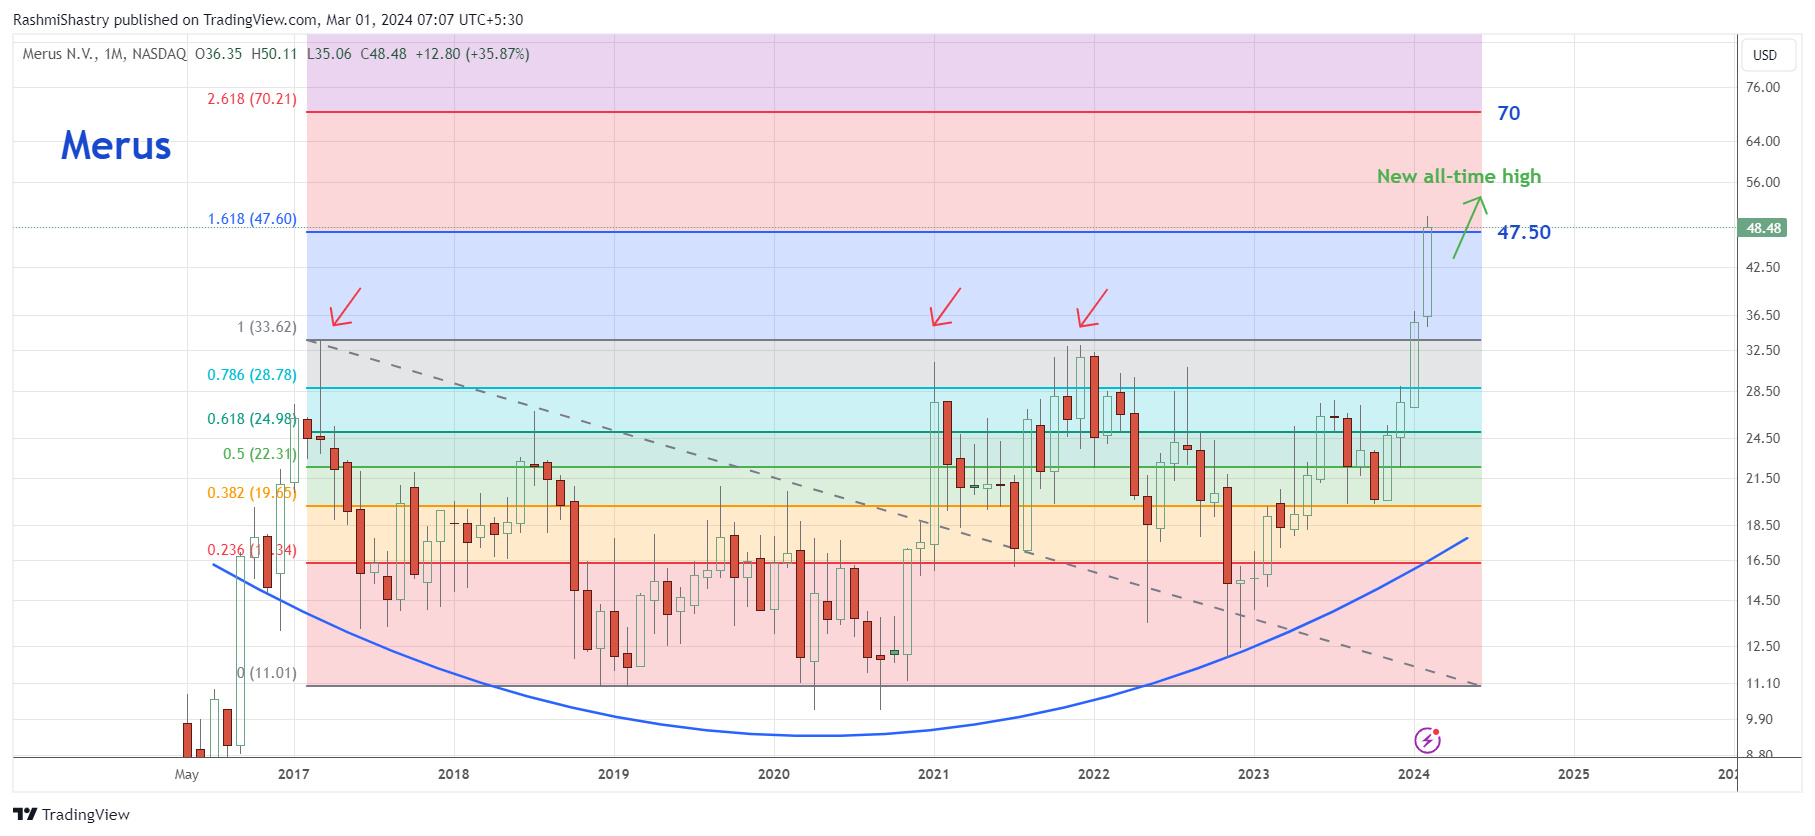
Within the Healthcare segment, Merus has been a strong performer over the past few months, closing in the green for the fourth consecutive month. The price has now moved past the 161.8% Fibonacci level at 47.50. With a sustained move, the next target to track could very well be 70. The price broke out of a sideways consolidation pattern and displayed more strength with a strong bullish candlestick in the month of February. |
|
|
JP Morgan Holding Down the Fort |
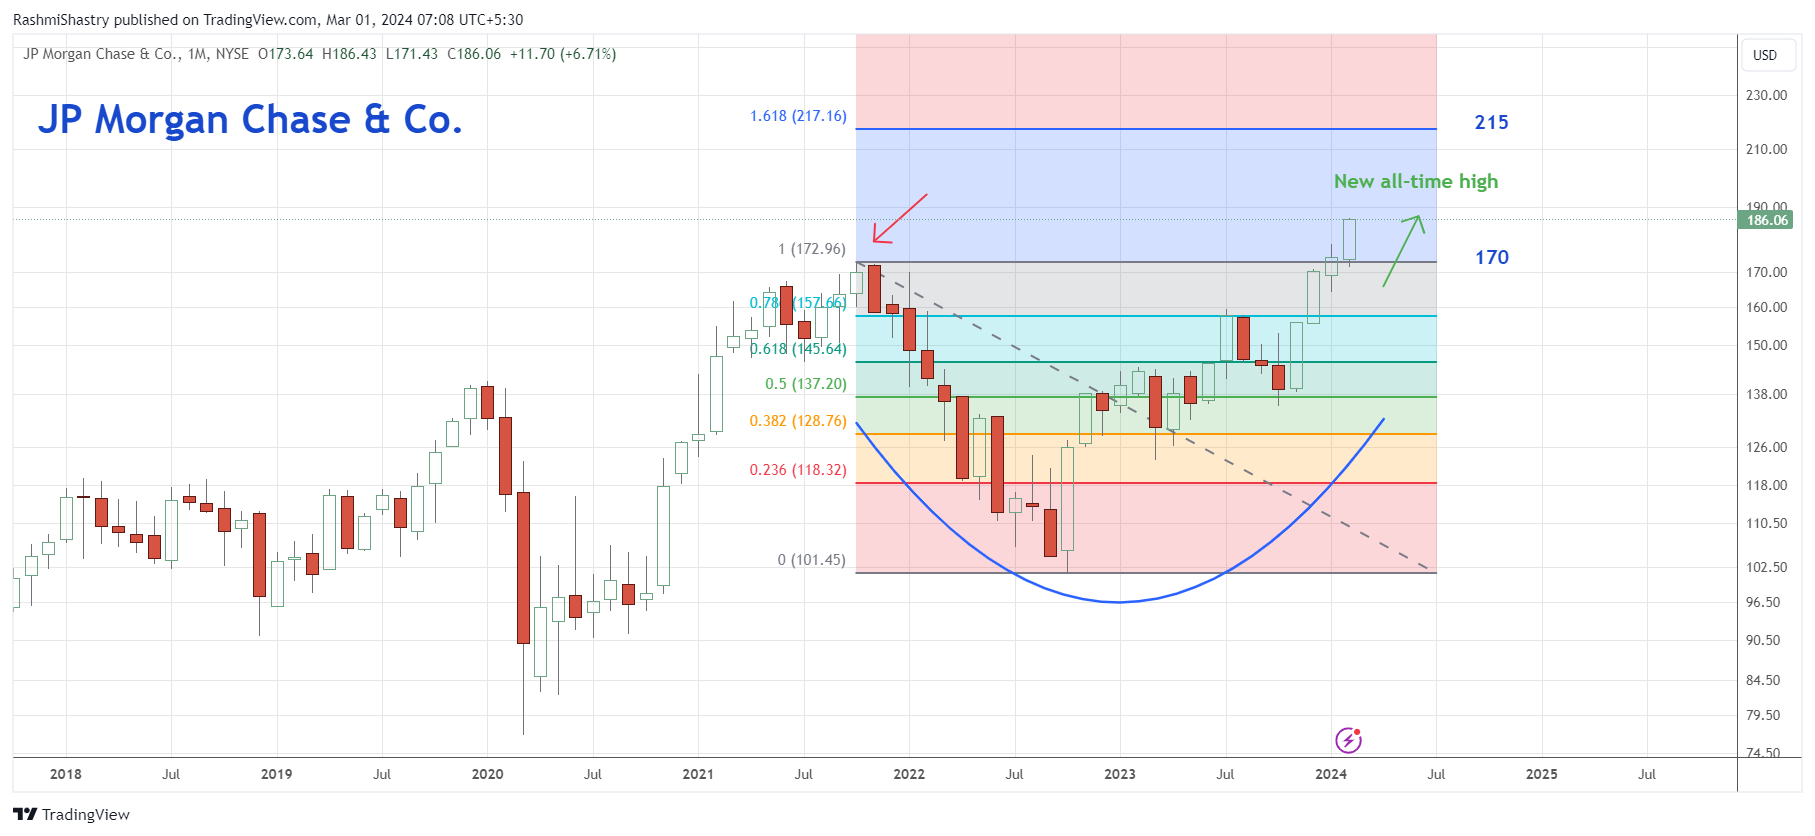
When you spend enough time in the market (or listen to enough wise people), you identify certain stocks that act as an index all by themselves. Berkshire, Caterpillar, JP Morgan Chase are all examples of one-man army indices. JP Morgan Chase has closed the month of February in the green and with a strong breakout. When you notice that the closing price of the candlestick is near the high of the time period, make a mental note of the strength of the move in that particular move. JP Morgan Chase has breached its two-year base, moving above the breakout level of 170. Currently trading at 186, the stock is poised to move higher towards 215. Financials are an important segment of the market. And JPM is an important part of the Financials. So if this stock is making new all-time highs, just how bad could things be? When the strongest members of the sectors are performing well, the health of the market is definitely not questionable. Sure there is always sector rotation to watch out for, but these tell-tale signs coming through are important indicators of the market move. |
|
|
Rashmi Bhatnagar, CMT is a Market Technician at All Star Charts India. Previously, she was an Equity Research Analyst at Enrich Investments in Hyderabad, India. She received her charter in February 2020 and has been a part of the financial markets since 2016. |
|
|
You are receiving this newsletter because you subscribed to the Chart Advisor newsletter. If you wish to unsubscribe, please click here. Dotdash Meredith 225 Liberty St, 4th Floor, New York, NY 10281
© 2024 All Rights Reserved. Privacy Policy | Terms of Service |
|
|
|