1/ Markets in a Robust Uptrend |
2/ Staying Invested inthe Strength |
3/ Quadrant Crossovers Indicate Potential Beginning ofRelative Outperformance |
4/ Results Potent withCompelling Technical Setup |
|
|
Investopedia is partnering with CMT Association on this newsletter. The contents of this newsletter are for informational and educational purposes only, however, and do not constitute investing advice. The guest authors, which may sell research to investors, and may trade or hold positions in securities mentioned herein do not represent the views of CMT Association or Investopedia. Please consult a financial advisor for investment recommendations and services. |
|
|
Markets in a Robust Uptrend |
Courtesy of StockCharts.com |
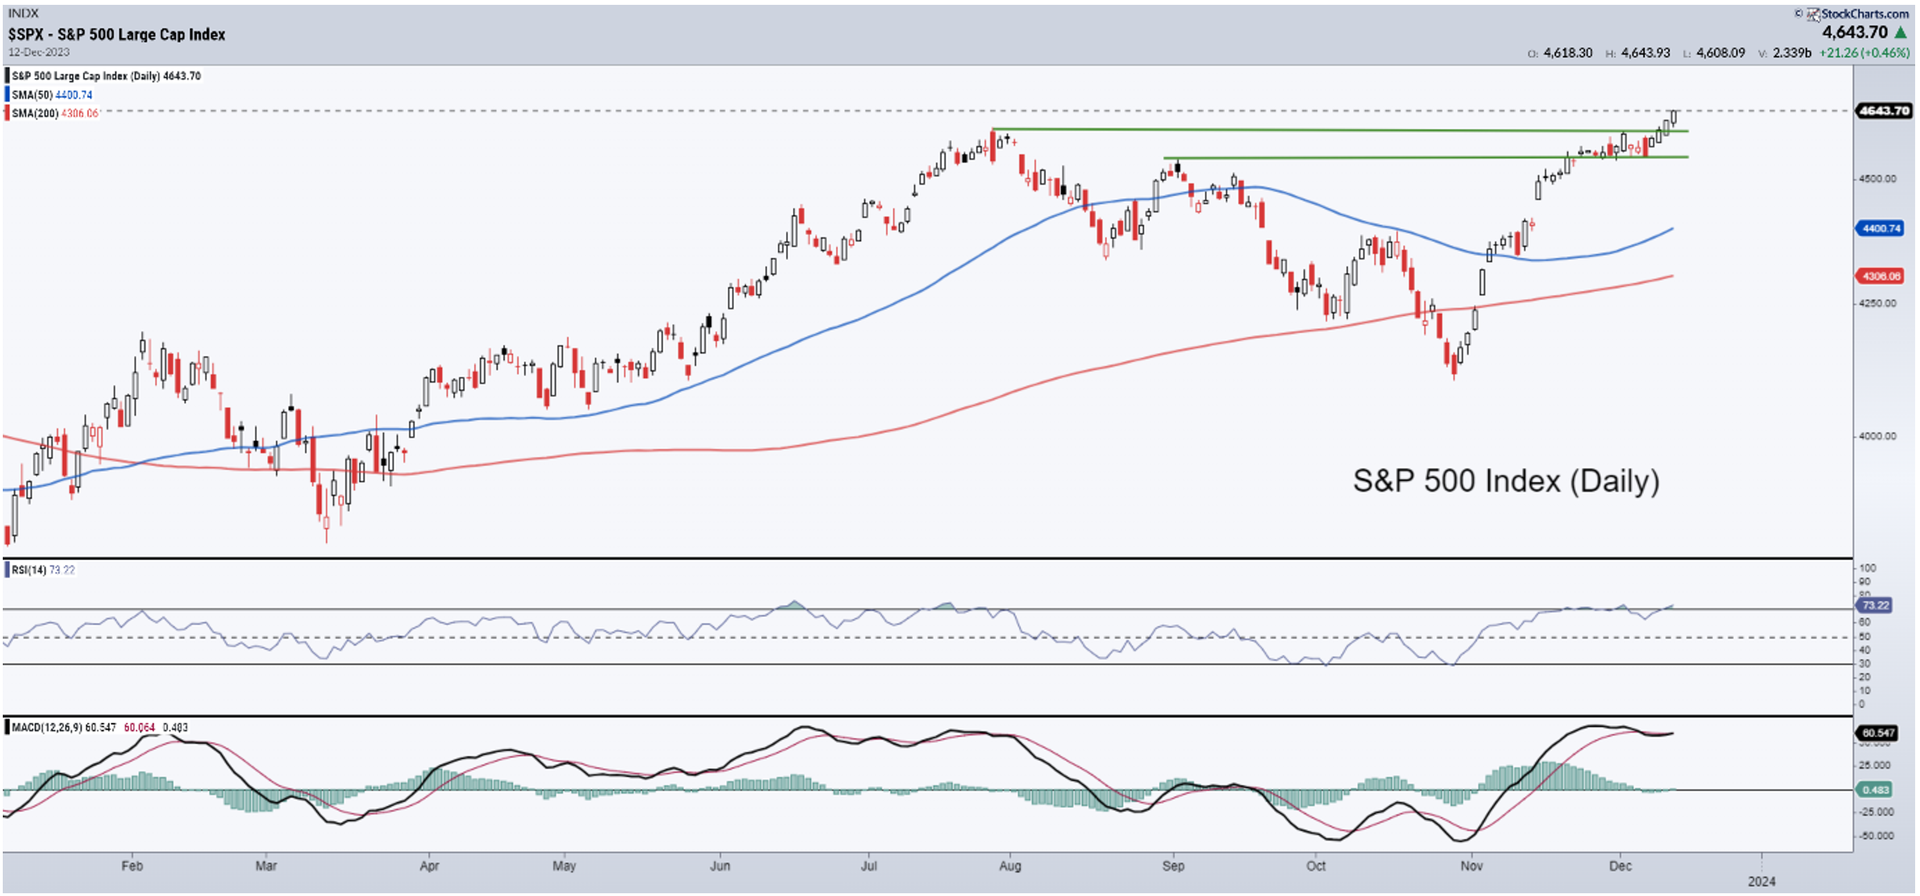
Six weeks of straight gains and counting; the broad market index S&P 500 has broken out from the key levels; it is seen marching towards the all-time high level of 4818 that were seen in 2022. While the weekly charts seem comfortable, the daily charts remain steeply overbought. Being overbought is a good sign and in strong uptrends, the index or a stock tends to stay overbought for prolonged periods; however, the structure looks a bit overextended. This increases the possibility of the markets marching higher towards their high but not without some consolidation at current or higher levels. |
|
|
Financial market research from professionals at the forefront of technical analysis innovation. |
| |
Staying Invested In The Strength |
During market all-time highs, staying invested in relatively stronger stocks is crucial for several reasons. First, these stocks often demonstrate resilience and momentum, providing a potential buffer against market downturns. Second, strong stocks tend to outperform during bullish trends, contributing to portfolio growth. Lastly, maintaining exposure to strength helps capitalize on market optimism and positive sentiment, enhancing overall investment returns. |
|
|
Quadrant Crossovers Indicate Potential Beginning Of Relative Outperformance |
Courtesy of StockCharts.com |
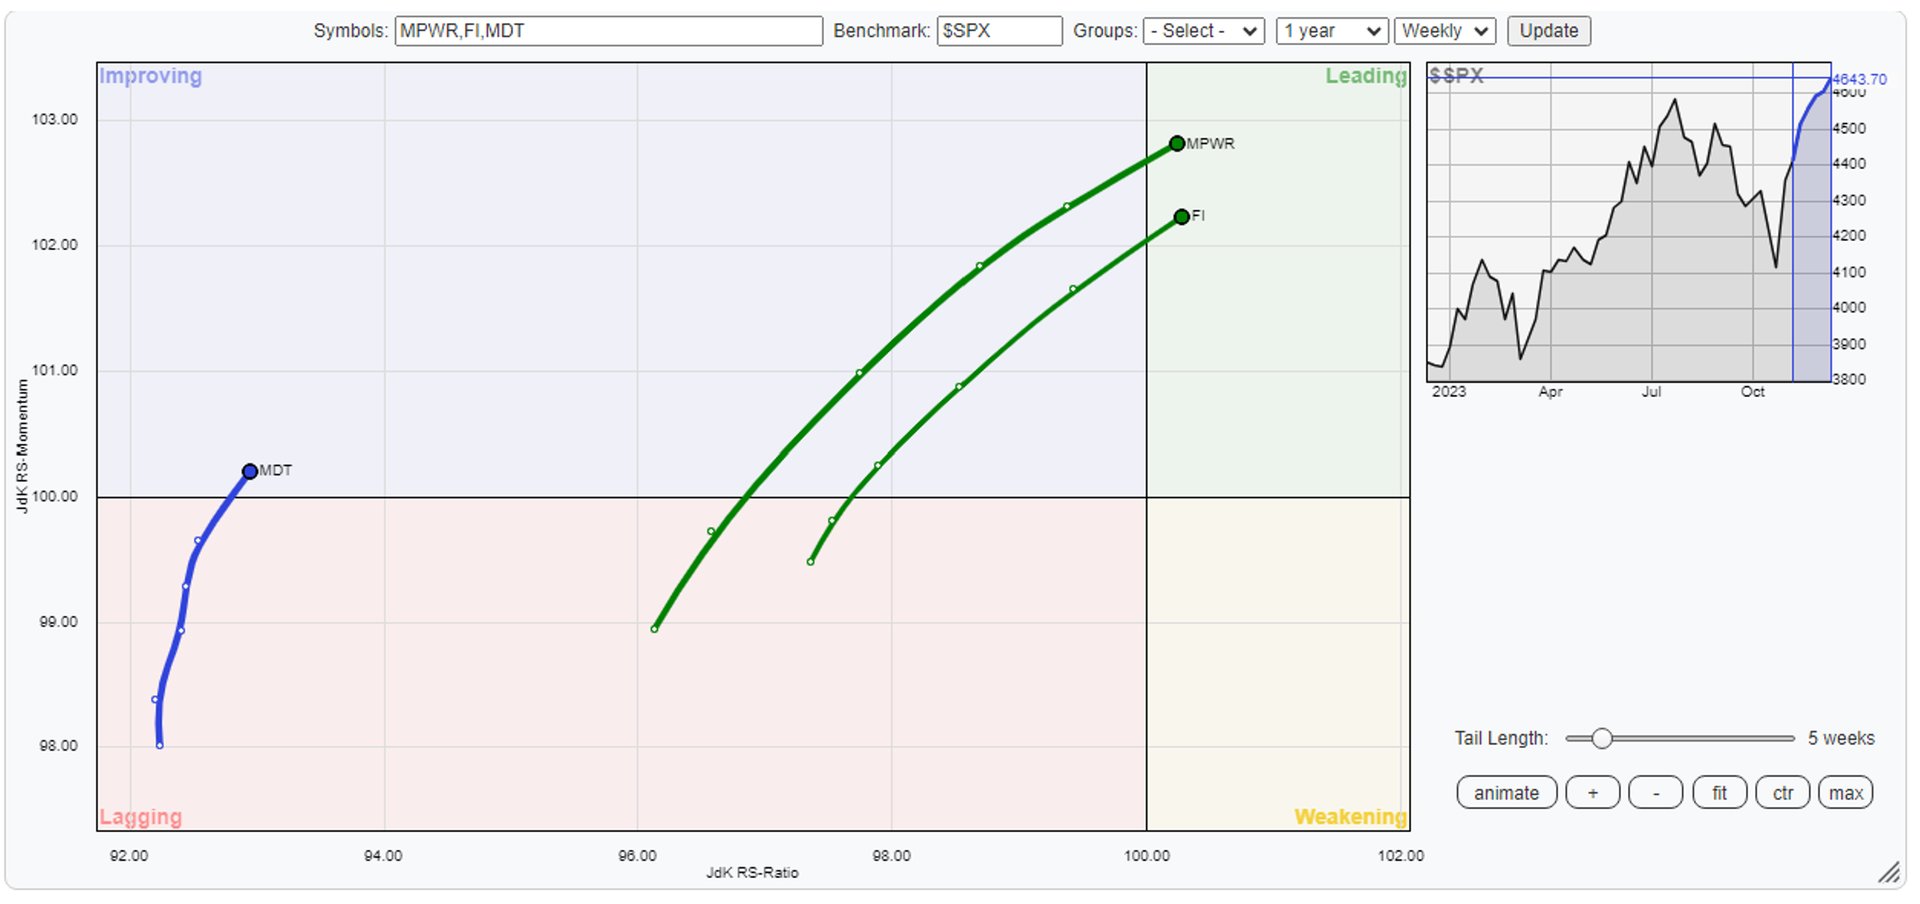
In Relative Rotation Graphs (RRGs), when a stock's JdK Momentum crosses above 100, it indicates a transition from the Weakening/Improving quadrant to the Leading quadrant or from Lagging Quadrant to the Improving quadrant. This crossover is significant as it signals a shift in relative strength, suggesting that the stock is gaining momentum and moving into a position of outperformance compared to the benchmark. Investors often interpret this crossover as a bullish signal, implying that the stock is exhibiting positive momentum and may continue to do well in the near term. It can be considered an opportune time for potential entry or reinforcement of existing positions, aligning with the expectation of the stock's continued relative strength compared to its peers. |
| |
Results Potent With Compelling Technical Setup |
Courtesy of StockCharts.com |
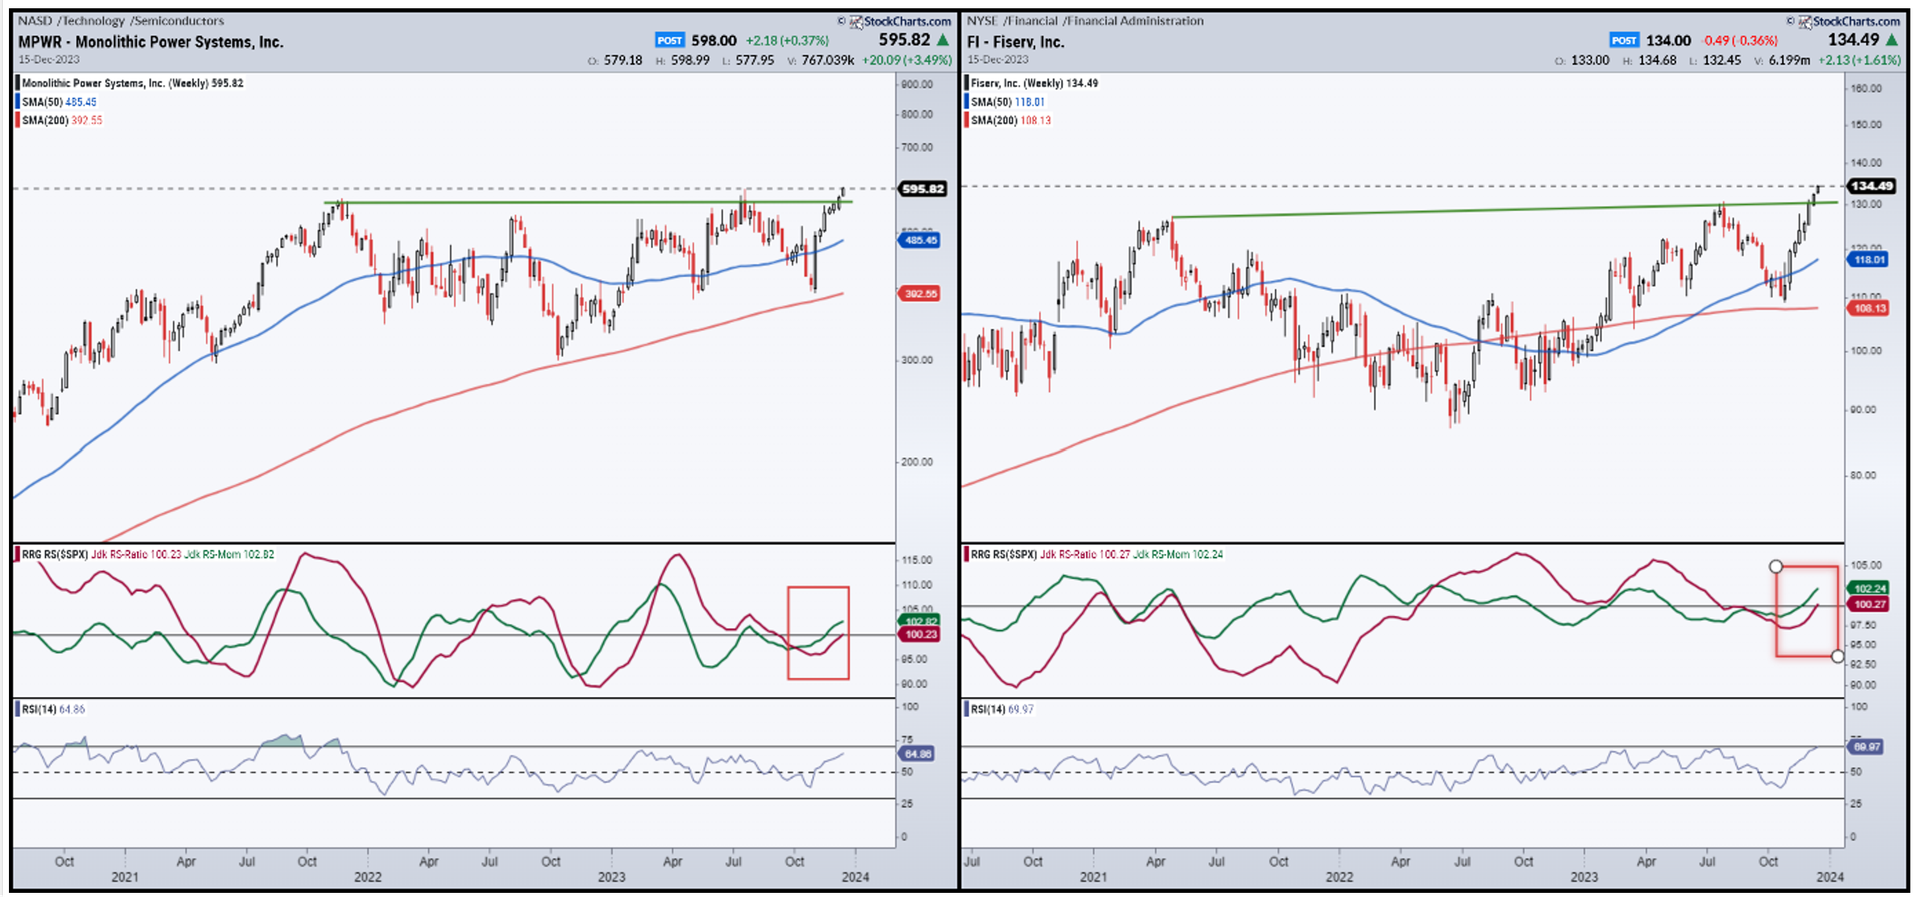
When Quadrant Crossovers take place and if they are backed up with a compelling and a potent technical setup, it makes an excellent combination. Both MPWR and FI have crossed over to the leading quadrant from the Improving quadrant. This means that going ahead from here, they are likely to relatively outperform the broader S&P500 index. Given the breakout and overall strong technical setup, being inside the leading quadrant will ensure that the stocks show a lot of resilience even if the markets consolidate; if they continue moving higher, these stocks can post strong relative outperformance. |
Courtesy of StockCharts.com |
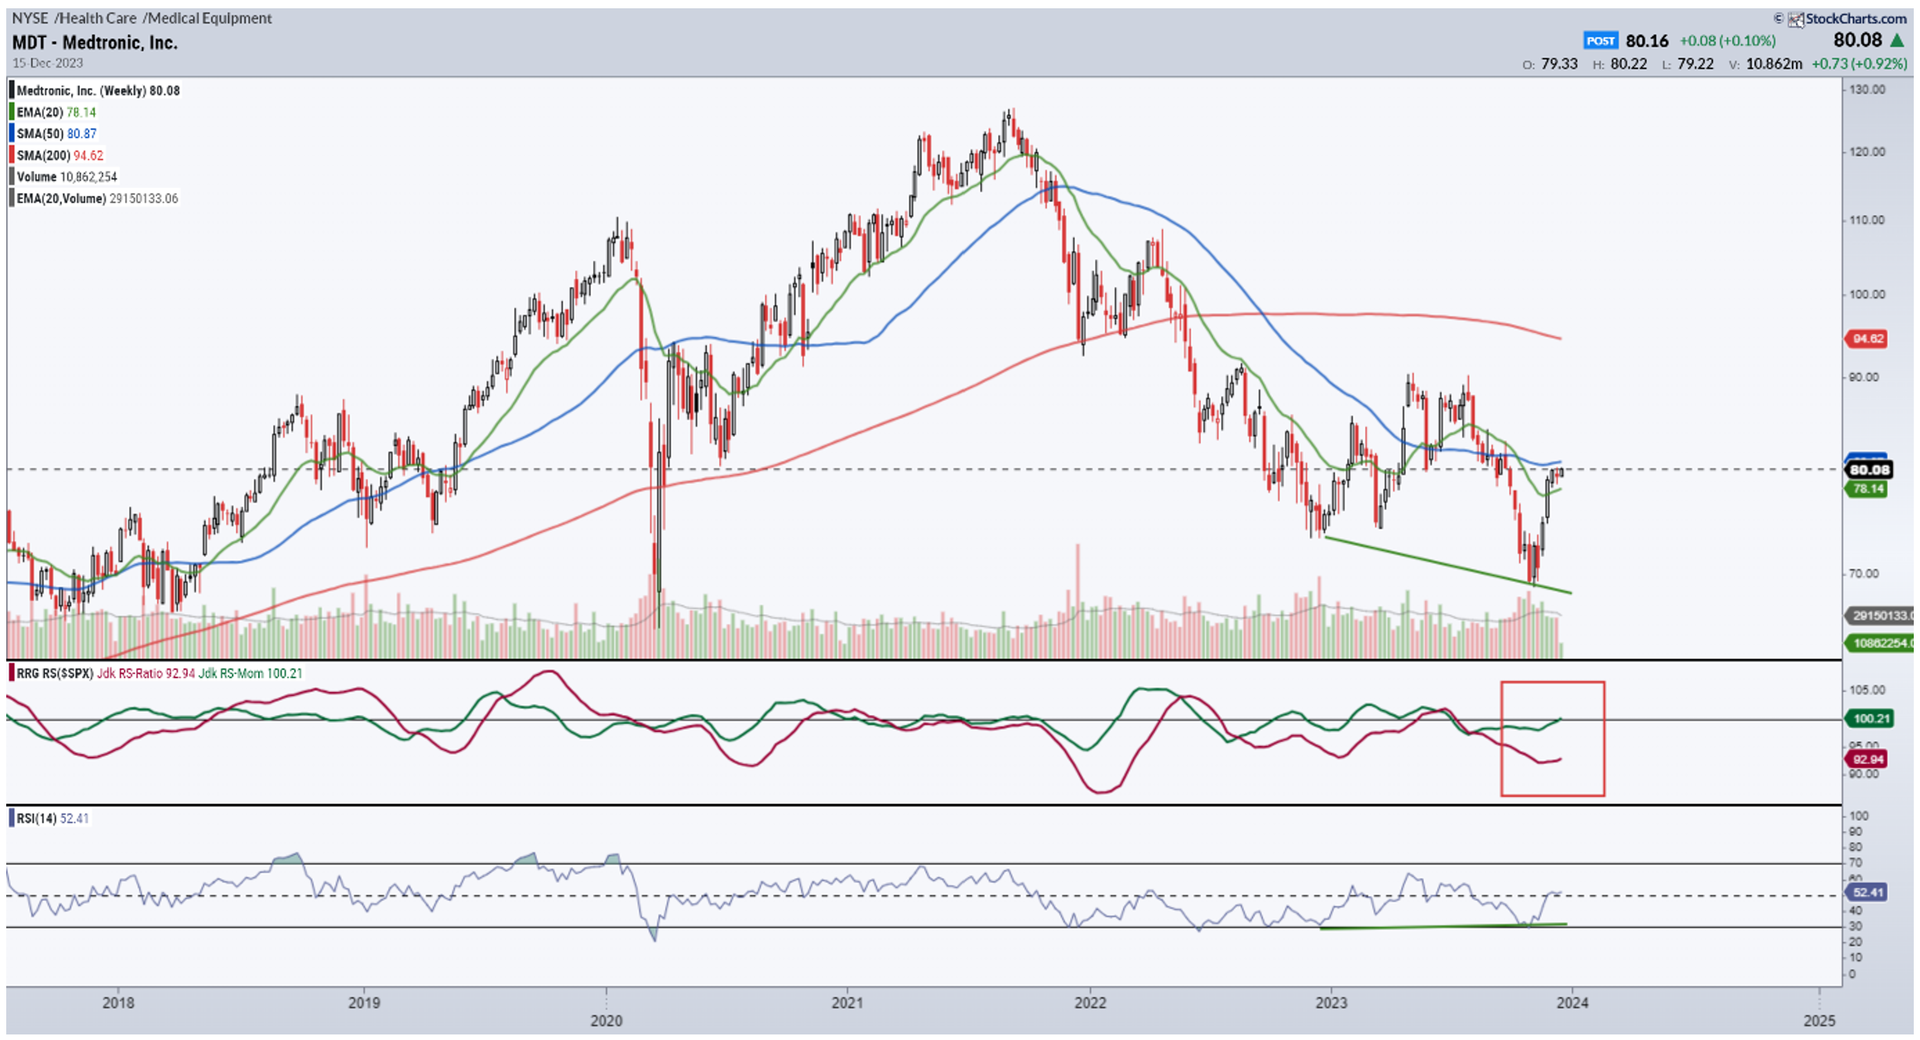
MDT on the other hand has rolled inside the Improving quadrant from the Lagging quadrant. The technical setup shows that the stock is making a strong attempt to put a bottom in place and may confirm a trend reversal. The last phase of the price decline has come with a bullish divergence of the RSI against the price. Importantly, while rolling inside the Improving quadrant, the stock is placed farthest among the three stocks from the center point; it is likely to generate higher alpha as compared to the other two stocks. |
|
|
Foram Chheda, CMT is a Technical Research Analyst anShe also serves as a volunteer on the CMT Association’s membership committee.d founder of chartanalytics.co.in. Foram frequently appears on CNBC Bajar, a part of the regional network of CNBC, the financial media group having one of the largest footprints across India. Foram is also seen regularly on ET Markets LIVE streaming where she shares her views on the Equity Markets. |
|
| You are receiving this newsletter because you subscribed to the Chart Advisor newsletter. If you wish to unsubscribe, please click here. Dotdash Meredith 225 Liberty St, 4th Floor, New York, NY 10281
© 2023 All Rights Reserved. Privacy Policy | Terms of Service |
|
|
|