By C. Theodore Hicks II, CFP®, CKA®, CMT®
|
|
|
1/ Stocks Don’t Go Up Forever |
2/ Look for Warning Signs |
|
|
Investopedia is partnering with CMT Association on this newsletter. The contents of this newsletter are for informational and educational purposes only, however, and do not constitute investing advice. The guest authors, which may sell research to investors, and may trade or hold positions in securities mentioned herein do not represent the views of CMT Association or Investopedia. Please consult a financial advisor for investment recommendations and services. |
|
|
Stocks Don’t Go Up Forever |
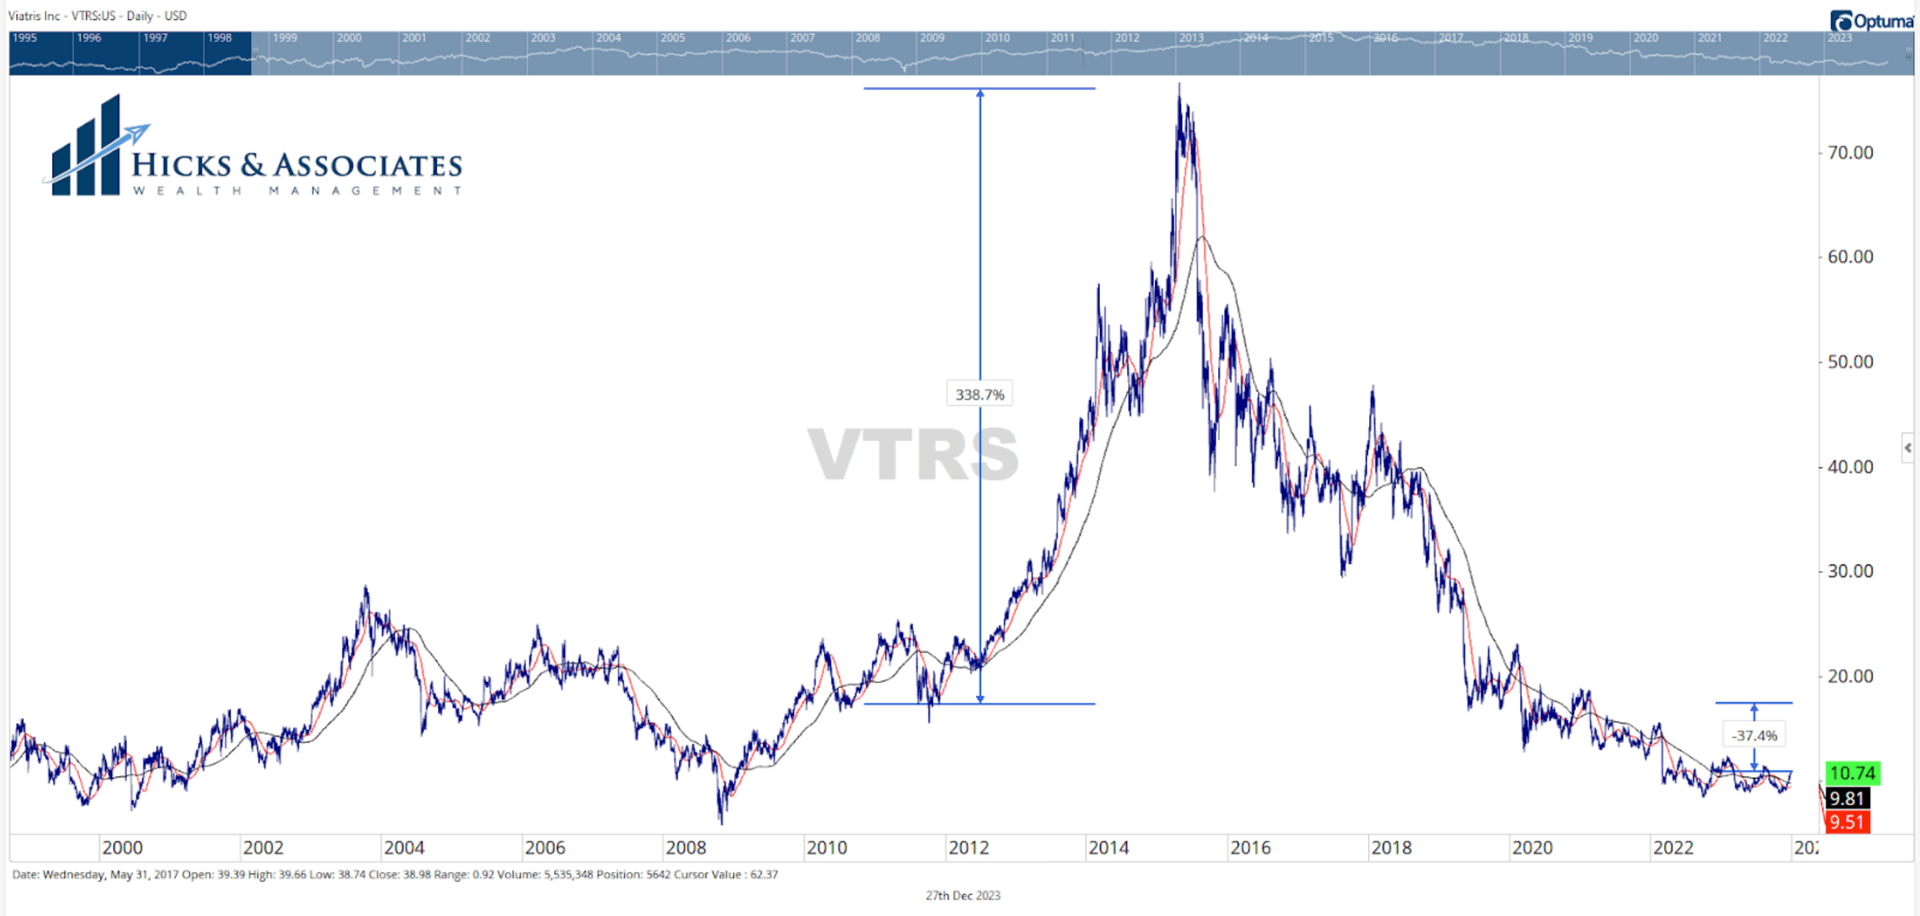
Today’s charts are pulled from a new case we are reviewing. Chart 1 is one of many stocks a prospective client has been holding for years. According to their brokerage statement, they bought this stock in mid-2011. From their buy point to the top, this prospective client was once sitting on a gain of ~338%. Shortly after hitting that peak, the stock then consolidated for about a month. |
|
|
Financial market research from professionals at the forefront of technical analysis innovation. |
|
|
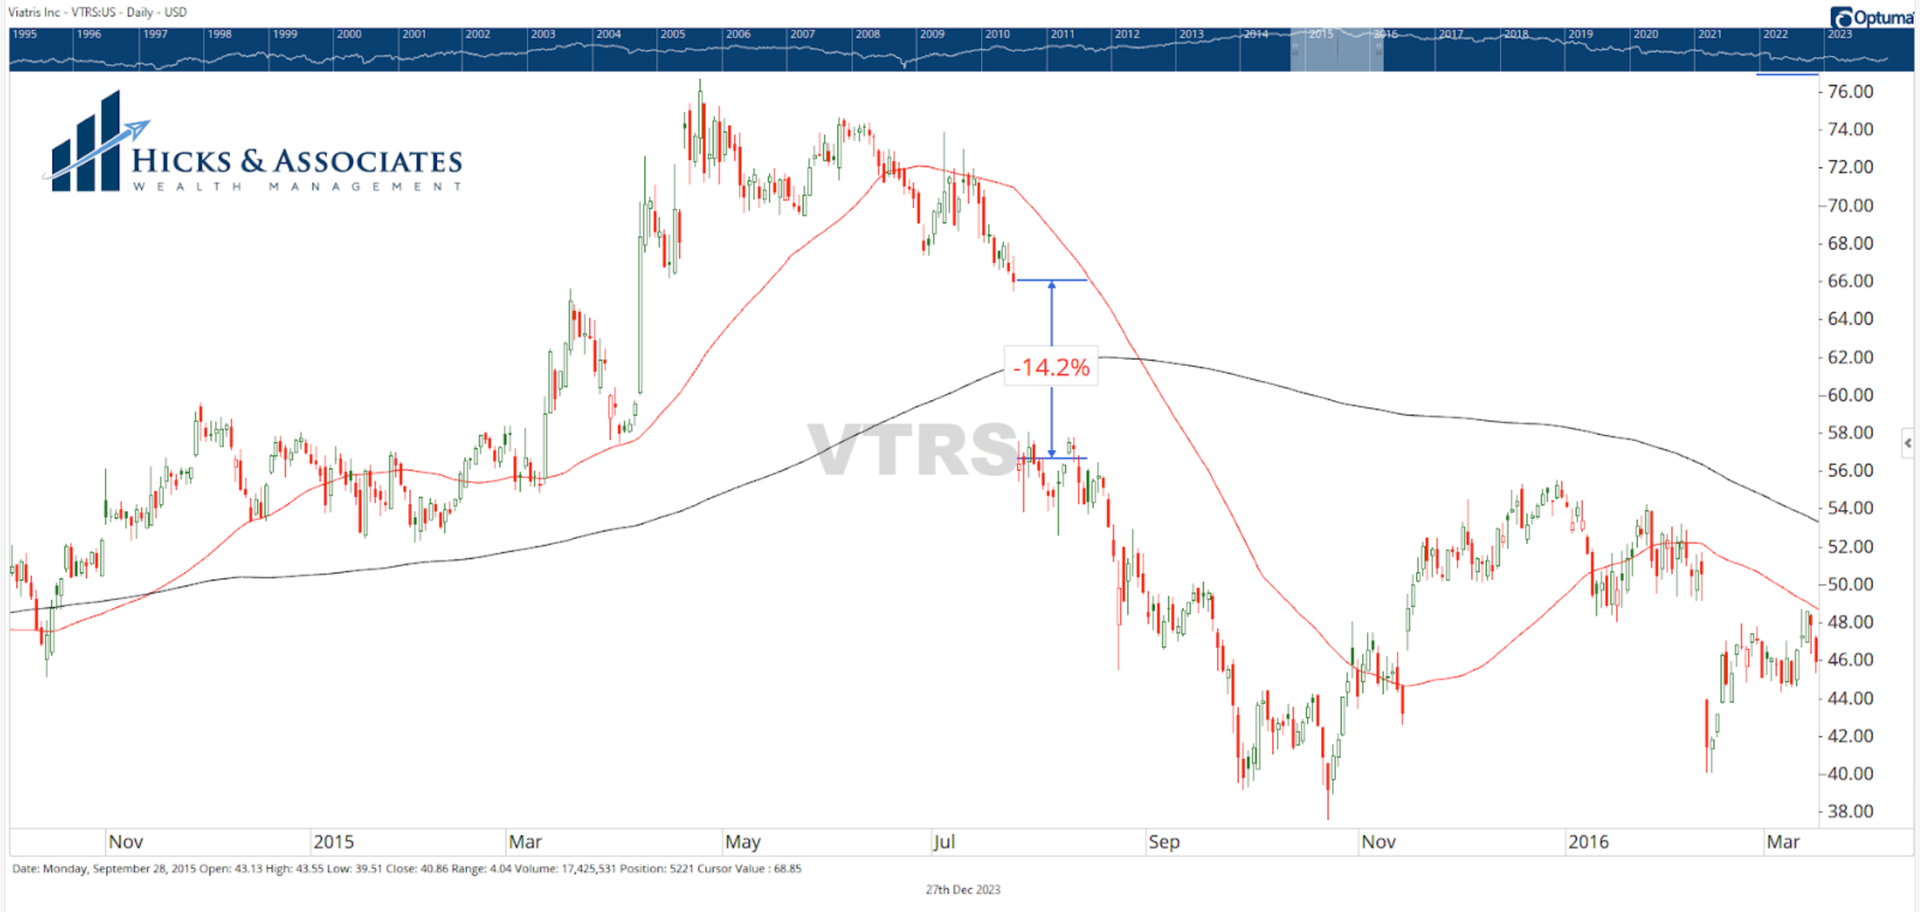
Chart 2 is the same chart just zoomed in so you can see the ~14% gap down at the open on Monday, July 27, 2015. In this situation, this large gap down should have shaken the prospective client out of this position. However, they did not have to endure even this negative movement - let alone the massive drop that was still to come. Prior to this day, the stock had started trading regularly beneath the 50-day moving average (red line). One or two closes below the 50-day moving average (when considering this individual’s low basis in the position) are not necessarily a reason to sell. But, in this case, the stock had started to live beneath the 50-day. For 25 days, this stock closed below the 50-day moving average. That is more than an entire month’s worth of trading. That was the first warning sign. Somewhere in that window, the sell order should have been given. This prospective client was once up ~338% in this position. But they continued to hold, likely just hoping that it would recover. They are currently sitting on a ~37% loss. Stocks do not go up forever. Hope is not an investment strategy. |
|
|
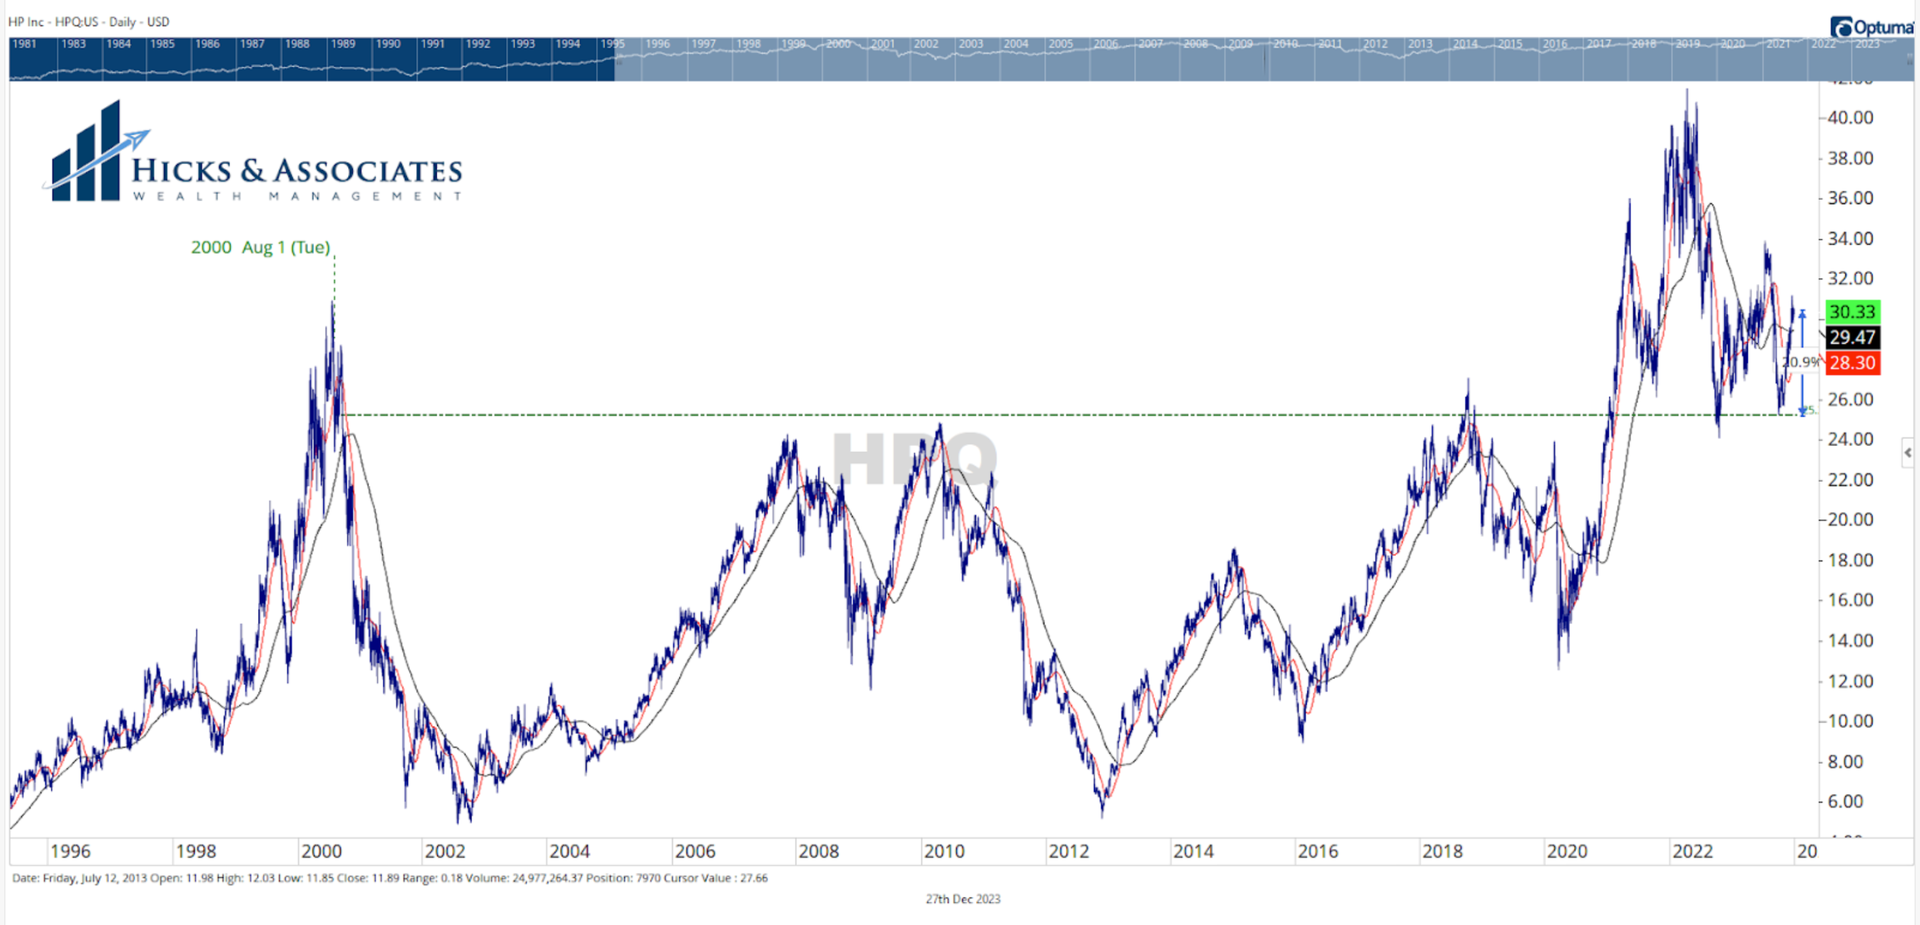
Chart 3 is another one of this prospective client’s positions. According to their brokerage statement, they bought this stock in August 2000. This is a company with which many readers will be familiar. It is a big, well known company that has been around for decades. Surely, this company is “safe”. Nope. There is no such thing as a “safe” stock. All stocks are dangerous unless they are going up. While the individual is currently up ~21% from their buy point, this position was underwater for more than 20 years. The green horizontal line represents the buy price. One could argue that this (eventually) worked out. However, there are 20 years of opportunity cost that this individual paid; unnecessarily, I might add. |
|
|
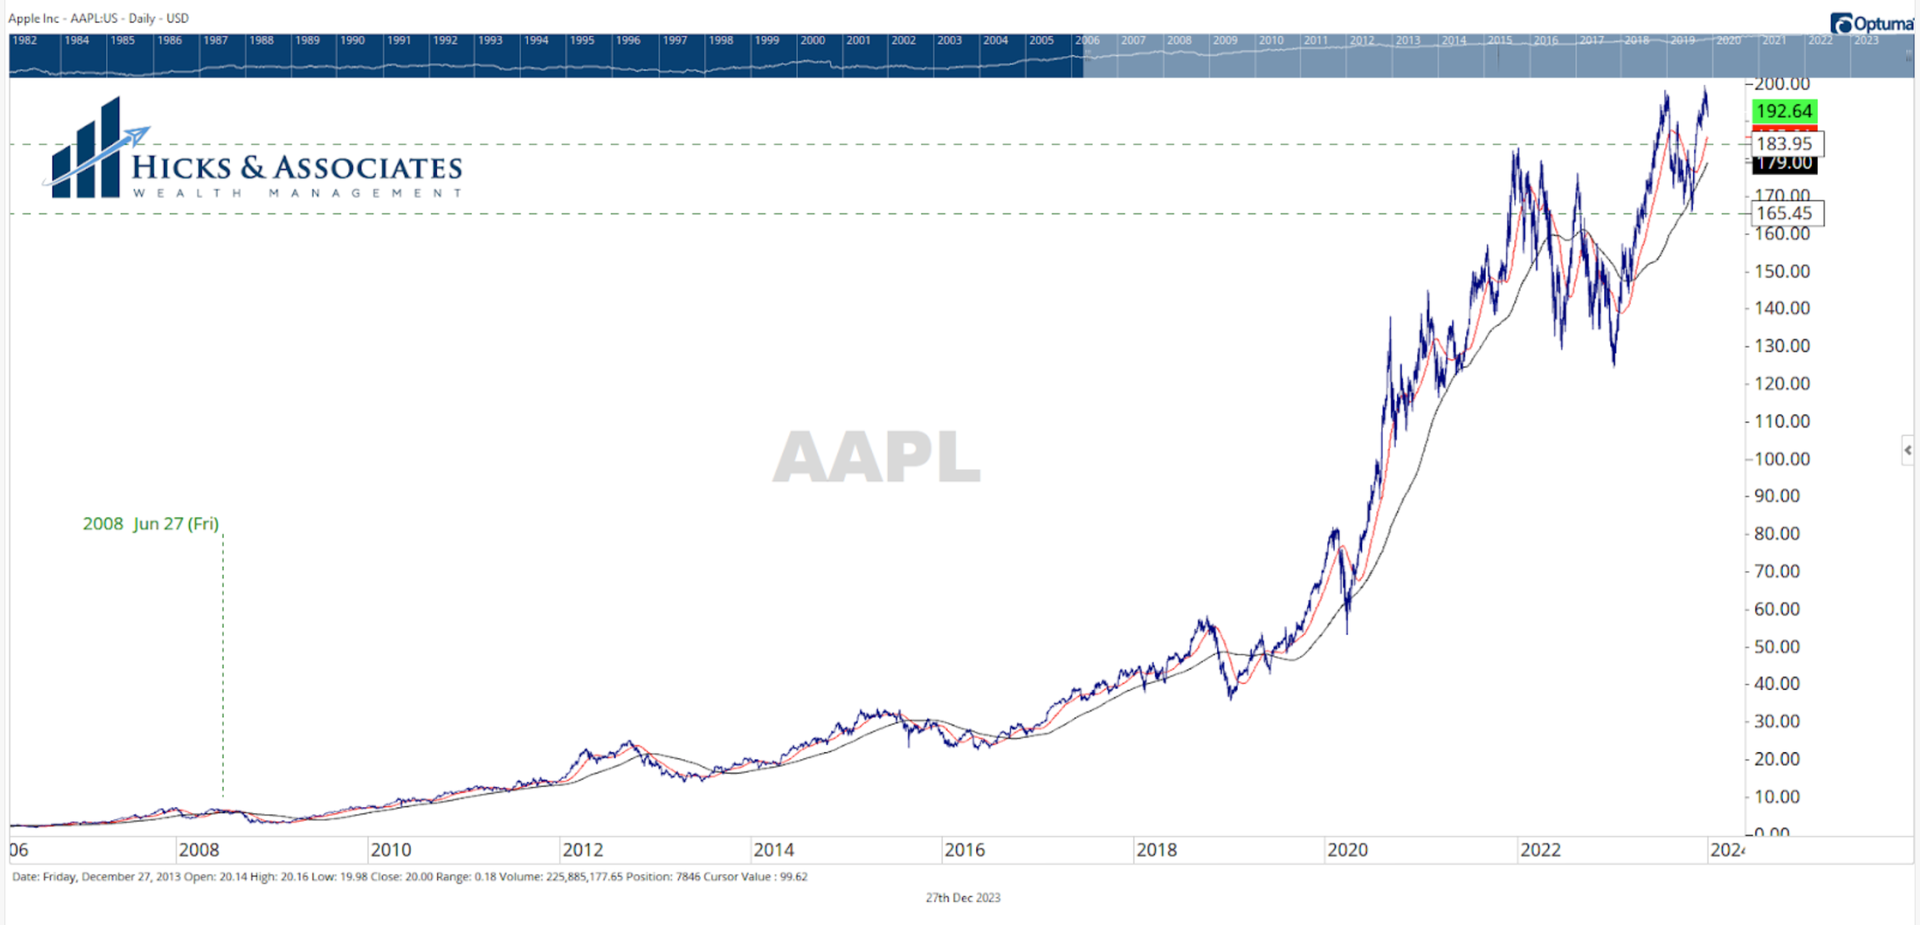
Over the years in this business I have learned that most clients look at page one of their investment statement … and that’s where their review ends. Very rarely do clients look beyond just the first page or two. As a result, I suspect this particular individual was like so many others; they merely checked their beginning and ending value of their portfolio once a month. Since they had a big winner in Apple, those large gains masked the losses in their other positions. And while this individual is going to be just fine, it does not change the lesson for the day: Stocks do not go up forever. Hope is not an investment strategy. And, yes, even Apples can fall. Ask Newton. If you do not have the time, the training or the temperament to manage your portfolio (which means monitor more than just page one of your investment statement), then consider hiring someone who will. A closing side note; you might have noticed the green dashed lines on Chart 4. Those lines are alerts. We do have clients in this stock. Those alerts are for different clients who have different entry points. If the alerts go off, we will either take action as previously agreed upon, or call the client to discuss the position. Again, if you are not going to monitor your investments, hire someone who will. Stocks do not go up forever. Not even the big names that you think will be around forever. |
|
|
Theodore Hicks, CMT is the Founder and Chief Investment Officer for Hicks & Associates Wealth Management, an SEC Registered Investment Adviser. Hicks and his team manage money for families and retail clients using a proprietary, multi-strategy investment process through a rules-based framework. Since most of their clients are either near or already in retirement, the process is designed to minimize downside risk. Hicks frequently posts charts and his thoughts to his LinkedIn and Twitter accounts. |
|
|
You are receiving this newsletter because you subscribed to the Chart Advisor newsletter. If you wish to unsubscribe, please click here. Dotdash Meredith 225 Liberty St, 4th Floor, New York, NY 10281
© 2023 All Rights Reserved. Privacy Policy | Terms of Service |
|
|
|