It Pays to Listen to the Market |
|
|
Investopedia is partnering with CMT Association on this newsletter. The contents of this newsletter are for informational and educational purposes only, however, and do not constitute investing advice. The guest authors, which may sell research to investors, and may trade or hold positions in securities mentioned herein do not represent the views of CMT Association or Investopedia. Please consult a financial advisor for investment recommendations and services. |
|
|
It Pays to Listen to the Market |
In my previous three articles, my goal was to drive home a few lessons I have learned as a technical analyst and portfolio manager over the past 30 years. Namely, technicians should not dismiss the importance of fundamentals, as they drive price trends. The better the fundamentals, the better the price trend. I also asserted however that fundamental managers should not be dismissive of price trends, which represent the opinion of the market, the best fundamental analyst on the planet. I drew a fine line between fundamentals, and opinions of fundamentals, and how those opinions can get us in trouble, especially when they disagree with the verdict of the market (i.e., price). |
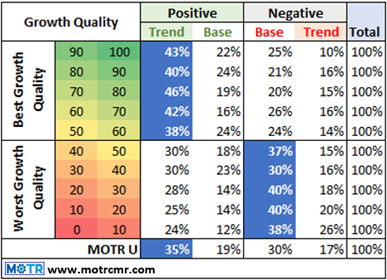
In today’s note, the final in this series, I want to bring this idea alive with a real time example of how an investor can listen to the message of the market, and look for overlap or agreement between that message and his or her own expectations. It’s in this agreement where the real magic happens. In the accompanying table, I am simply combining the output of two of my models, one for long-term price trend (along the top of the table), and one for Growth Quality (along the left). This exercise alone shines a bright light on the power of technical analysis, in that we can quickly scale our research across 2700 stocks in the few minutes it takes to run the model. In the words of one of the greatest macro investors in history, Stanley Druckenmiller, “I can look at 3,000 charts in an hour. How long do you think it would take me to read 3,000 annual reports?” In the trend model, we are able to bucket each of the 2700 stocks into one of four stages, and then simply ask the question, “where are all these stocks right now?” Looking at the bottom of the table, we can see that 35% of the 2700 stocks in the MOTR Universe are in a clear uptrend, 19% are in a base of an uptrend, 30% are in a base of a downtrend, and 17% are in a clear downtrend. The 35% uptrend value is highlighted in blue since it is the largest trend stage of the four. This means that a majority of stocks are in some form of long-term uptrend (35% + 19% = 54%), which happens to be the highest reading since early 2022, when the bear market started. From this perspective, we can say that the market is in better shape today than at any time over the past two years. This is different. Next, when we mash this long-term trend model together with the Growth Quality model, which is presented in 10 deciles (top decile being best), we can now ask the market, the best fundamental analyst on the planet, “what is the current trend condition of the top decile of growth, and how does that compare to both the market average, and the bottom deciles of growth?” Here, we can see that 43% of the top decile of growth quality is in a long-term clear uptrend, which compares favorably to the market average of 35% (discussed above), and even more favorably to the bottom decile of growth quality (24%). In fact, all top five deciles of growth quality house more long-term uptrends than the bottom five deciles. At the same time, all five lower deciles of growth quality have more stocks still in long-term bases of former downtrends than the top five deciles, as well as the market itself (30%).
For me, as a research provider and portfolio manager, I always begin with long-term price trend, which reveals the market’s learned opinion of global affairs and their impact on equities. If the majority of trends are bullish, as they are now, I want to be fully invested with no short exposure. However, with 54% of 2700 stocks in an uptrend, that means I have a list of roughly 1500 stocks from which to build my portfolio. This growth quality model is one of a suite of models I use to further align my focus with the message of the market. In this case, as I screen through this long list with positive long-term trends, I want to favor those with a high-quality growth score.
|
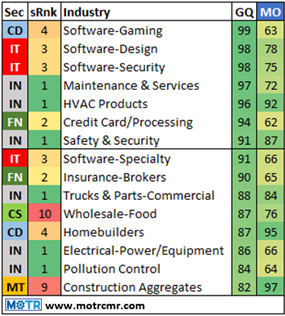
Typically, my next step might be to remove any industry groups that do not screen well according to price and momentum, then focus on industries with the best overall growth quality score. This next table features those industries remining for my consideration. One thing that jumps off this table, for me at least, is that semiconductors don’t make the cut. This is a good reminder that screening the market is incredibly helpful, but it should not serve as your sole idea generator. Remain curious, find out why semis are not on this list. Another thing that strikes me when I look at this table is how diverse the market’s leadership is. These industries are mostly “pure” cyclical, or “growth” cyclical. Philosophically, if the market, in its infinite wisdom, was concerned with what it saw over the horizon in terms of the macro picture, would this be what was leading today? Wouldn’t staples and utilities be dominating this list, as they did throughout 2022? |
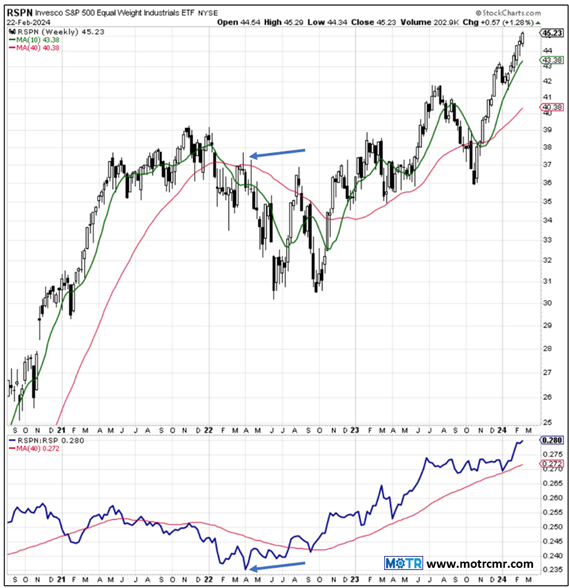
It might surprise most to learn that the Industrial sector (not Tech) has provided the most consistent leadership over the past couple of years, including during the 2022 bear market. This final image is a chart of the Industrial sector, equally weighted (top panel), relative to the S&P, equally weighted (lower panel). The blue arrows indicate where relative performance bottomed (lower panel) just as the Industrial sector, along with the rest of the market, peaked in early 2022. With this being the case, and with 6 of the 15 industries featured on the second table hailing from the #1 ranked Industrial sector, this is where I would spend a lot of my time looking for ideas in 2024. |
|
|
David Lundgren, CMT, CFA has more than three decades of investment industry experience, with a focus on technical analysis strategies, particularly momentum and trend following. He launched and Co-Hosts “Fill the Gap”, CMT Association’s official podcast and is a member of CMT Association’s board of directors. He has started several research and investment firms, including hedge fund Lyceum Capital, Breakaway Research, and most recently MOTR Capital Management & Research, Inc. |
|
|
You are receiving this newsletter because you subscribed to the Chart Advisor newsletter. If you wish to unsubscribe, please click here. Dotdash Meredith 225 Liberty St, 4th Floor, New York, NY 10281
© 2024 All Rights Reserved. Privacy Policy | Terms of Service |
|
|
|