1/ What’s Happening in China? |
4/ No, It’s Not All Technology |
|
|
Investopedia is partnering with CMT Association on this newsletter. The contents of this newsletter are for informational and educational purposes only, however, and do not constitute investing advice. The guest authors, which may sell research to investors, and may trade or hold positions in securities mentioned herein do not represent the views of CMT Association or Investopedia. Please consult a financial advisor for investment recommendations and services. |
|
|
What’s Happening in China? |
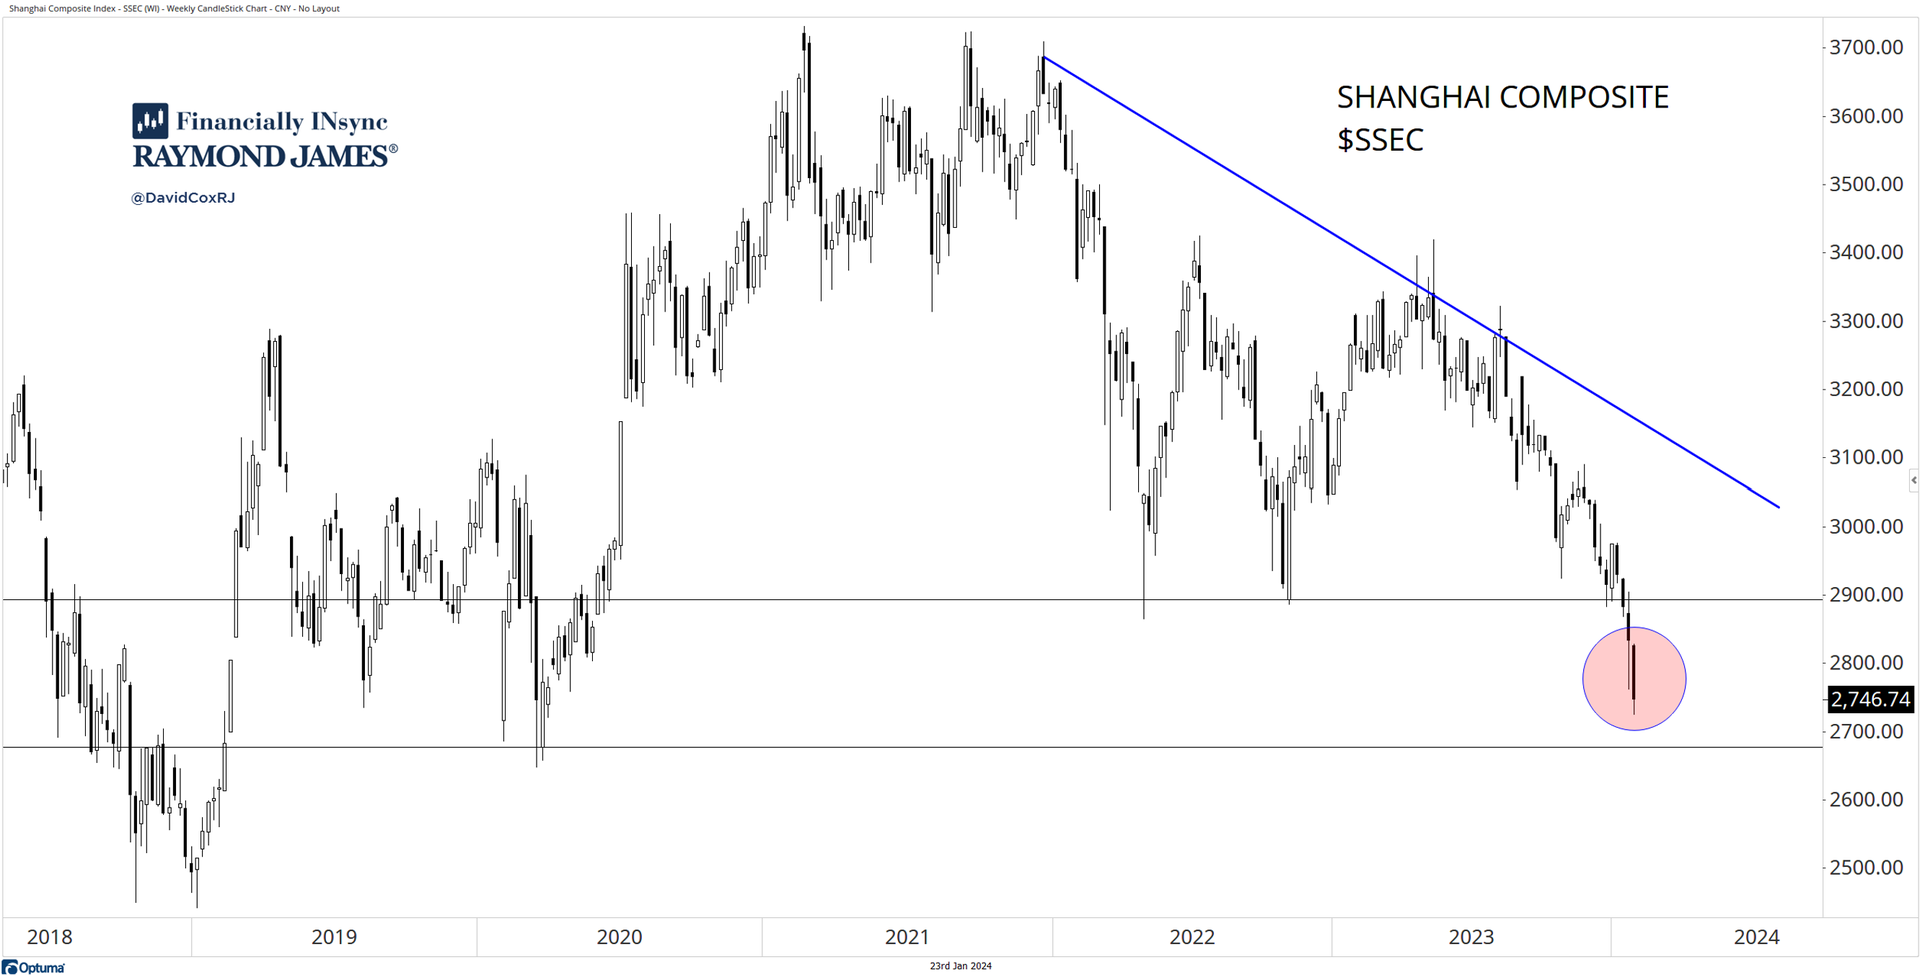
Stocks in Shanghai are heading down and that is not my opinion, it’s price. The weekly chart has lower highs and lower lows and appears to be heading en route to levels seen during #COVID selloff lows as a possible level of support on the chart. Why argue with price? |
|
|
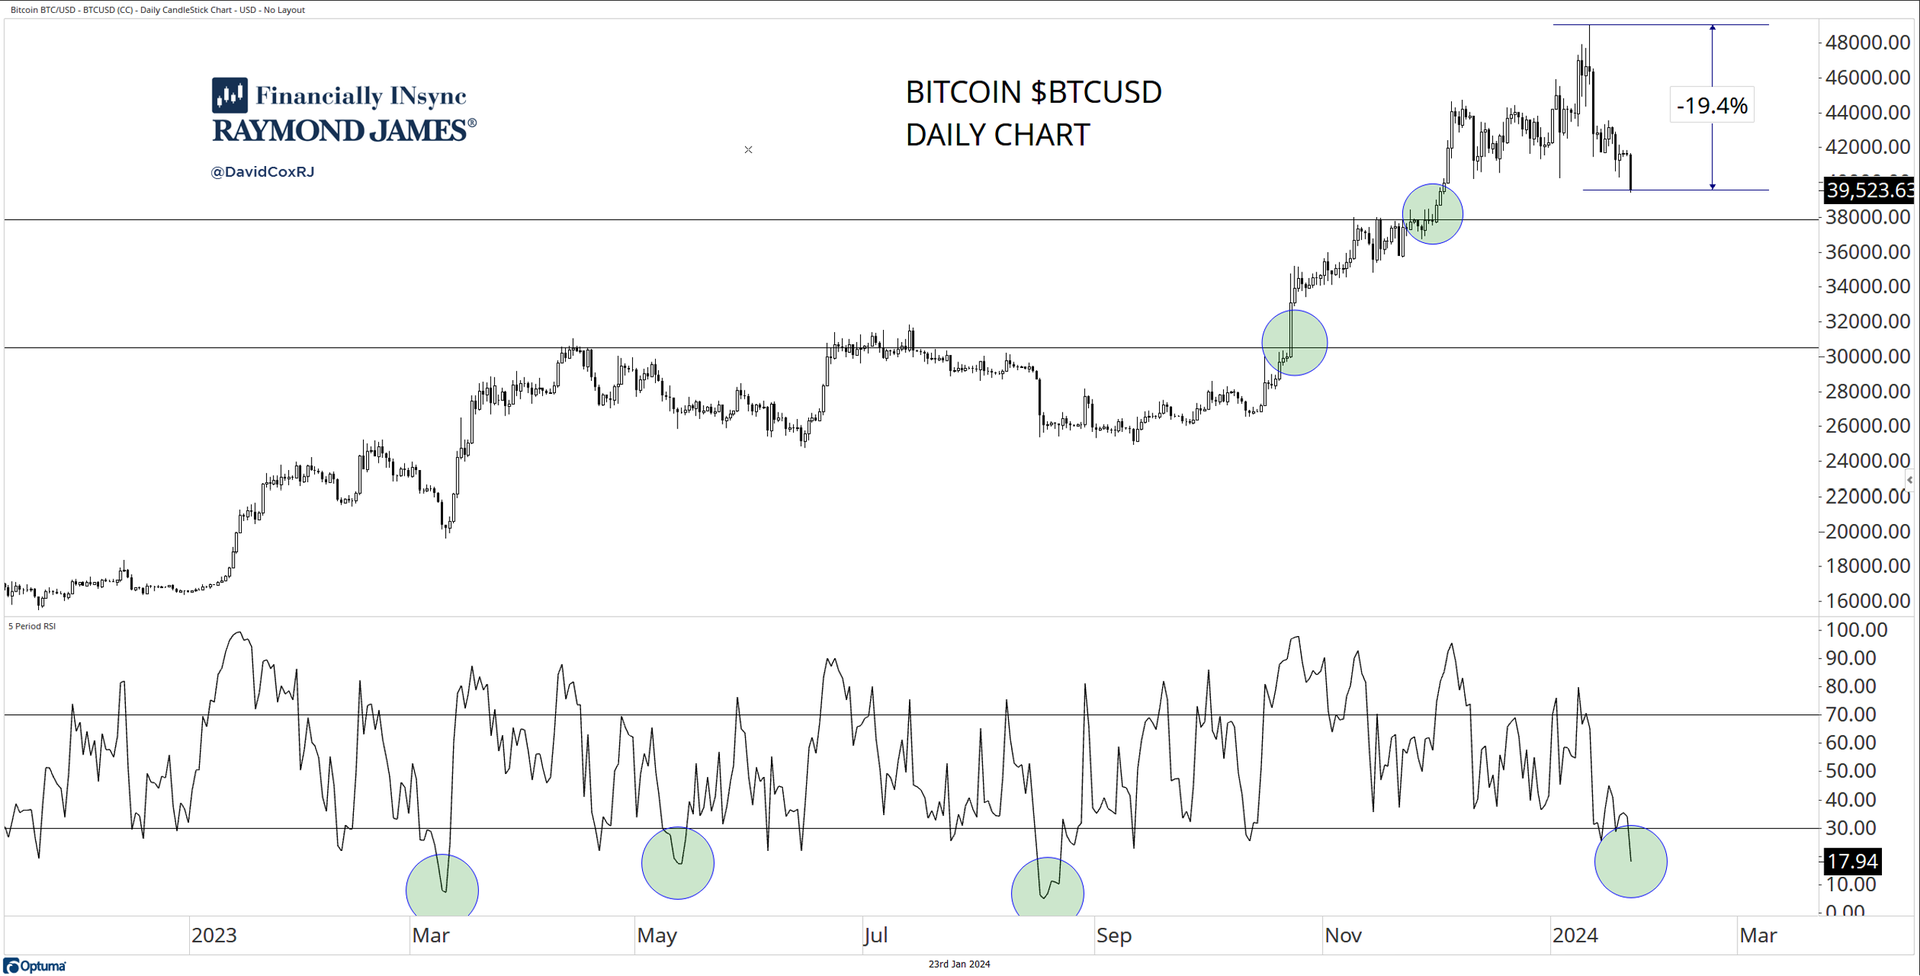
Amidst great enthusiasm and headlines that dominated the market about recent Exchange Traded Fund (ETF) approvals, the newest investors, who waited for the new ETFs to be launched entered right before a correction in the price. Bitcoin #BTC is down about -20% since the launch, but what does the daily chart show? After the most recent mid-’23 consolidation (that occurred after a strong early ’23 run-up), Bitcoin broke through $30,000 USD with fervour and ran all the way up to touch $49,000 after the approvals. The daily chart smooths out the swings and the headlines and looks like an uptrend to me. I’m a big fan of using the Relative Strength Index (RSI) and we’re quite oversold on an RSI(5) basis (green circles). Oversold is not some green light, or infallible tool that justifies decision-making or action. Oscillators are useful, but an understanding of trend must be first be known. I’m a fan of buying oversold pullbacks in uptrends. But buying oversold pullbacks in downtrends isn’t the same strategy. Not at all. |
|
|
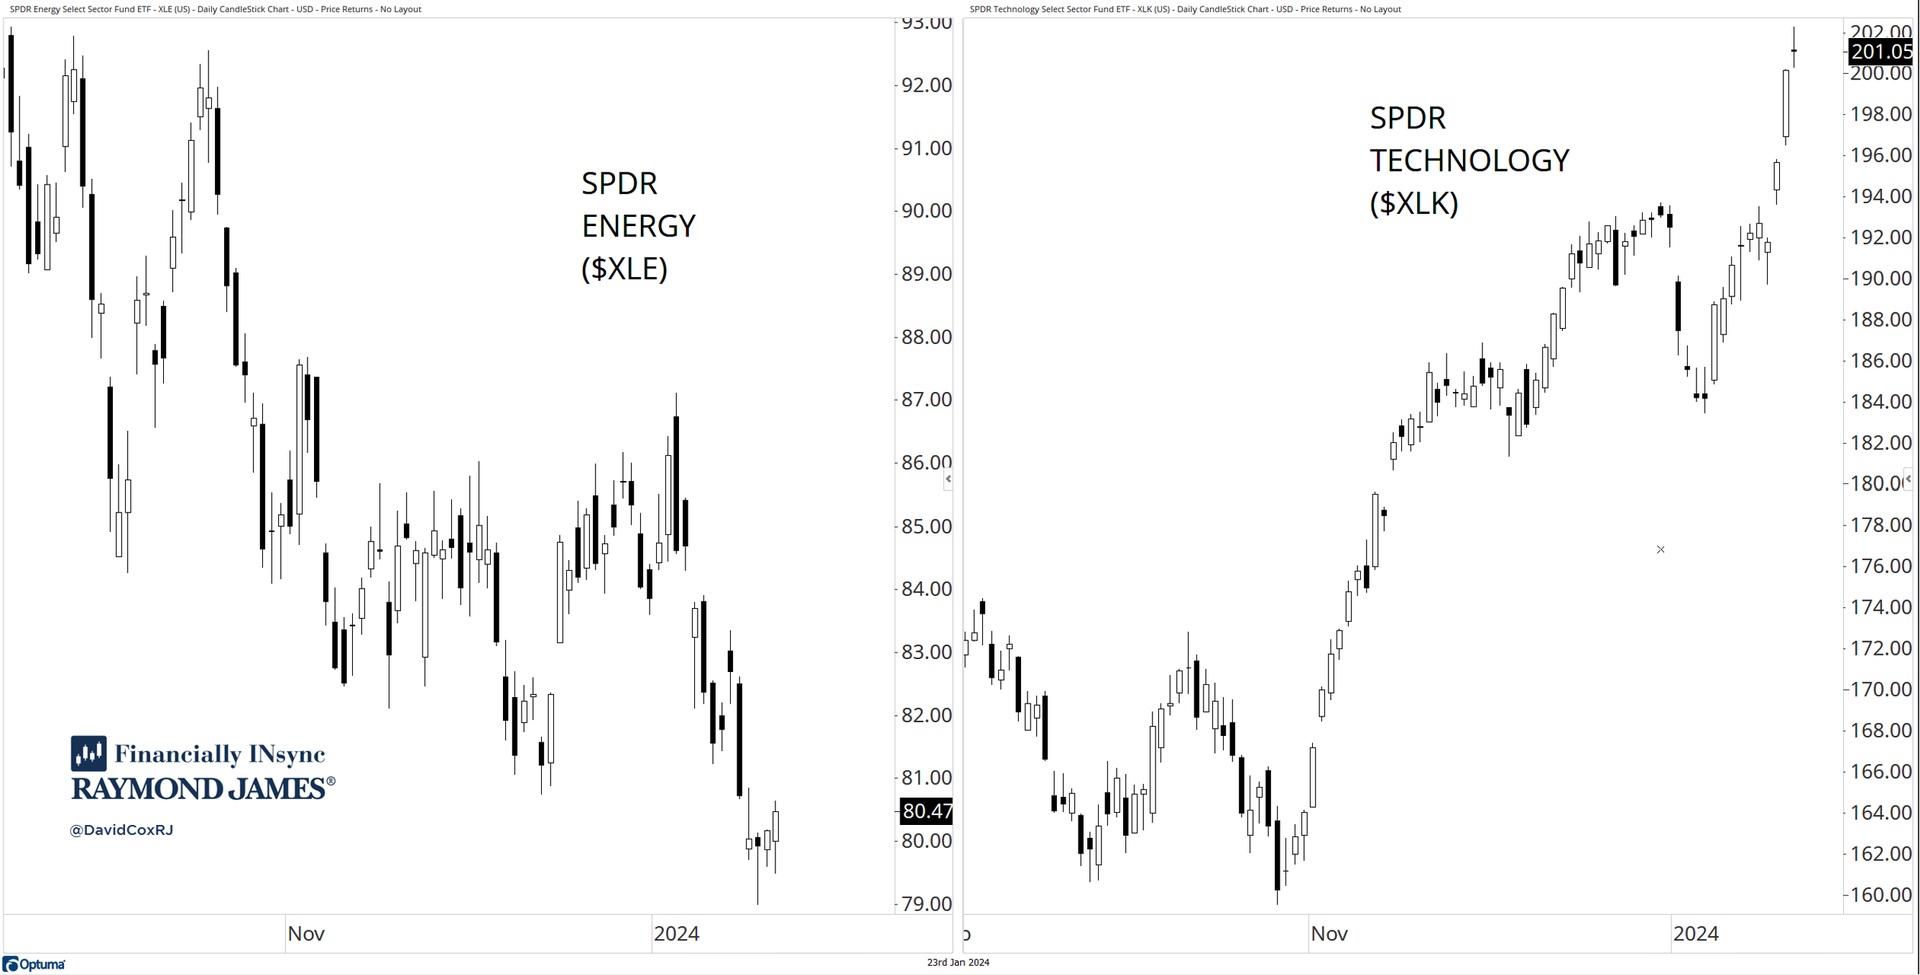
Technology has without question been beastly in performance since the ’22 stock market bottom and if we compare returns even in recent months since the fall ’23 correction lows, one will find technology continues to impress investors, who appear willing to pay higher and higher prices for the stocks within. On the left side, we can see the SPDR Energy ($XLE) stocks in the past several months in a lower highs and lower lows downtrend and technology of course, looks like the polar opposite. I always say, I really don’t care what the narrative says, but I do care about price. If we stand in the way of strong downtrends, we can get hurt both financially and mentally. Trend following really does work, but it’s not always easy. Emotions make it difficult to want to buy something that has risen in price to establish a strong price trend without you. The feeling that you’ve missed the boat is easy to experience. But trends can continue for longer than we’d might otherwise think likely. So seek to get better at identifying them, both uptrends and downtrends. |
|
|
No, It’s Not All Technology |
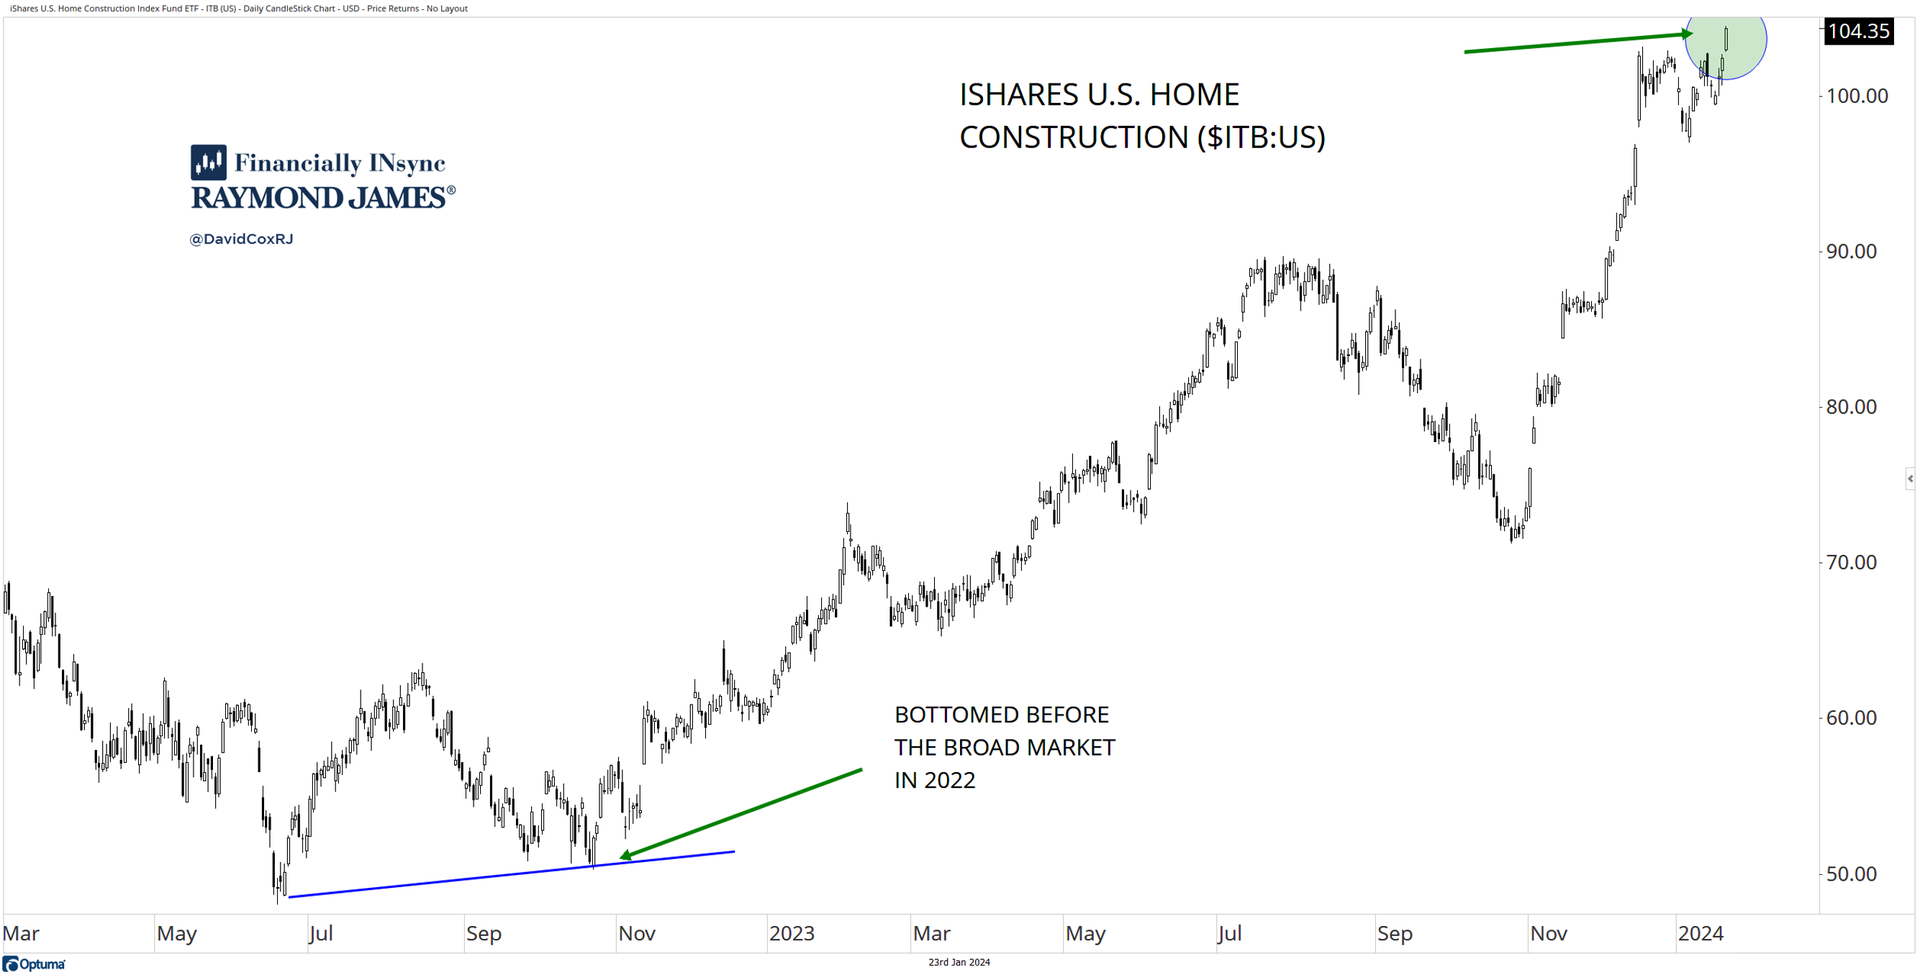
There are some investors intent on calling out technology as the only game in town, even using it as a rationale to explain that the stock market makes no sense, that it’s a bubble and it can’t go on. Another strong trend, is the U.S. homebuilder stocks ($ITB) which touched new highs again this week. This industry group is in the consumer discretionary sector and the group is a strong one. It also happens to be one of the few areas that bottomed ahead of the market in 2022 (hint: these are good characteristics to watch for in markets). Early leading groups (and stocks) can give investors a leg up in setting expectations in markets. Either way, the builders have been very strong and are in long-term uptrends. So it’s certainly one other area that trend followers know is out there, and outside of the dominating technology force. |
|
|
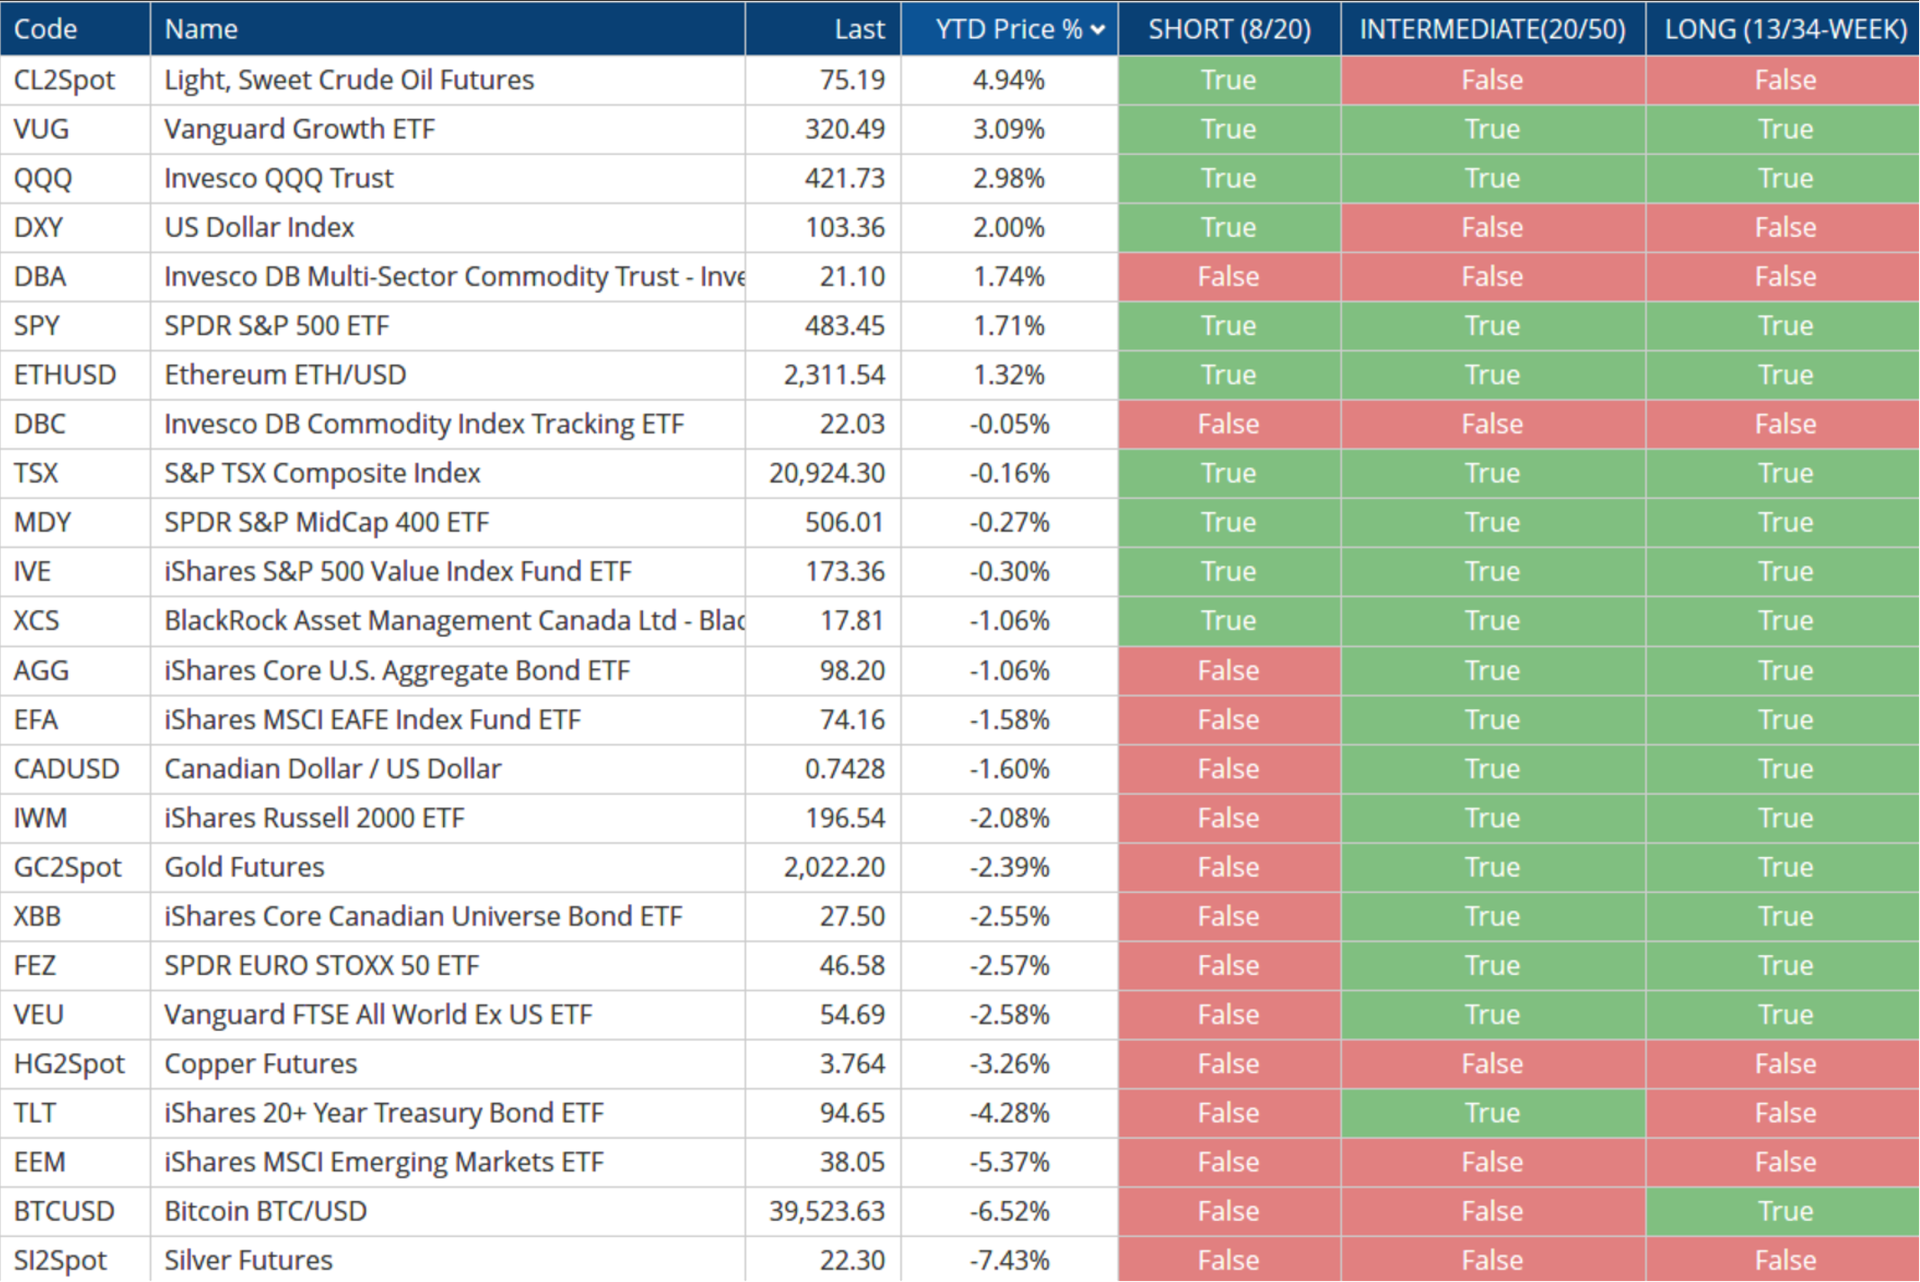
Those of you that follow me on “X”, or watch my Friday #WhereDoWeStand webinar (email david.cox@raymondjames.ca to subscribe) have seen my regular tables, like this one, that shows us the trend on a variety of time frames. Here’s our “all asset” list, sorted by YTD returns (in ’24) and the short, intermediate and long-term trends of each asset. But how do we define trends? One way is to use the condition of two moving averages, on a given time frame. If the shorter-term average is above the longer-term average, it’s an uptrend and vice versa. We define the short-term trend using the 8/20-day exponential moving averages (EMA). If the 8EMA > 20EMA, it says “True”, and suggests an uptrend. The intermediate-term is based on the 20-day EMA and the 50-day SMA, and the longer-term average uses the 13 and 34-week EMAs. You may disagree with my time frames, but the technique can be applied to whatever time, or chart frequency that fits with your objectives and your beliefs. Take the time to study the information. |
|
|
About This Week's Authors |
David Cox, CMT, CFA, FCSI, FMA is a dual holder of both the Chartered Market Technician (CMT) and the Chartered Financial Analyst (CFA) designations and is a Senior Portfolio Manager at “Financially Insync” at Raymond James Ltd., in Waterloo, Canada. He manages assets for Canadian, U.S. and International clients using a fundamentally screened, yet technically driven process and produces a weekly webinar called “Where Do We (Investors) Stand?” each Friday. You can find him on “X” at @DavidCoxRJ as he openly and candidly shares charts and perspectives without bias. |
Conor White, CMT, CIM started his career in wealth management in August of 2017. He holds both the Chartered Market Technician (CMT) and Chartered Investment Manager (CIM) designations. He graduated from Wilfrid Laurier University's Honours Bachelor of Business Administration (BBA) program in 2015 with a concentration in Finance and Economics. Trade analytics, attribution, security screening, order execution, and technical market research are among his many responsibilities as part of the Financially INsync team. Born and raised in Guelph, his interests include music, travel, art and technology. |
|
|
You are receiving this newsletter because you subscribed to the Chart Advisor newsletter. If you wish to unsubscribe, please click here. Dotdash Meredith 225 Liberty St, 4th Floor, New York, NY 10281
© 2024 All Rights Reserved. Privacy Policy | Terms of Service |
|
|
|