1/ Looking Opportunities for there Generation Through Quadrant Crossovers |
2/ Multi-month Breakout in CI |
3/ ORCL Staring at a Meaningful Upmove |
4/ Promising Setup in ACGL |
|
|
Investopedia is partnering with CMT Association on this newsletter. The contents of this newsletter are for informational and educational purposes only, however, and do not constitute investing advice. The guest authors, which may sell research to investors, and may trade or hold positions in securities mentioned herein do not represent the views of CMT Association or Investopedia. Please consult a financial advisor for investment recommendations and services. |
|
|
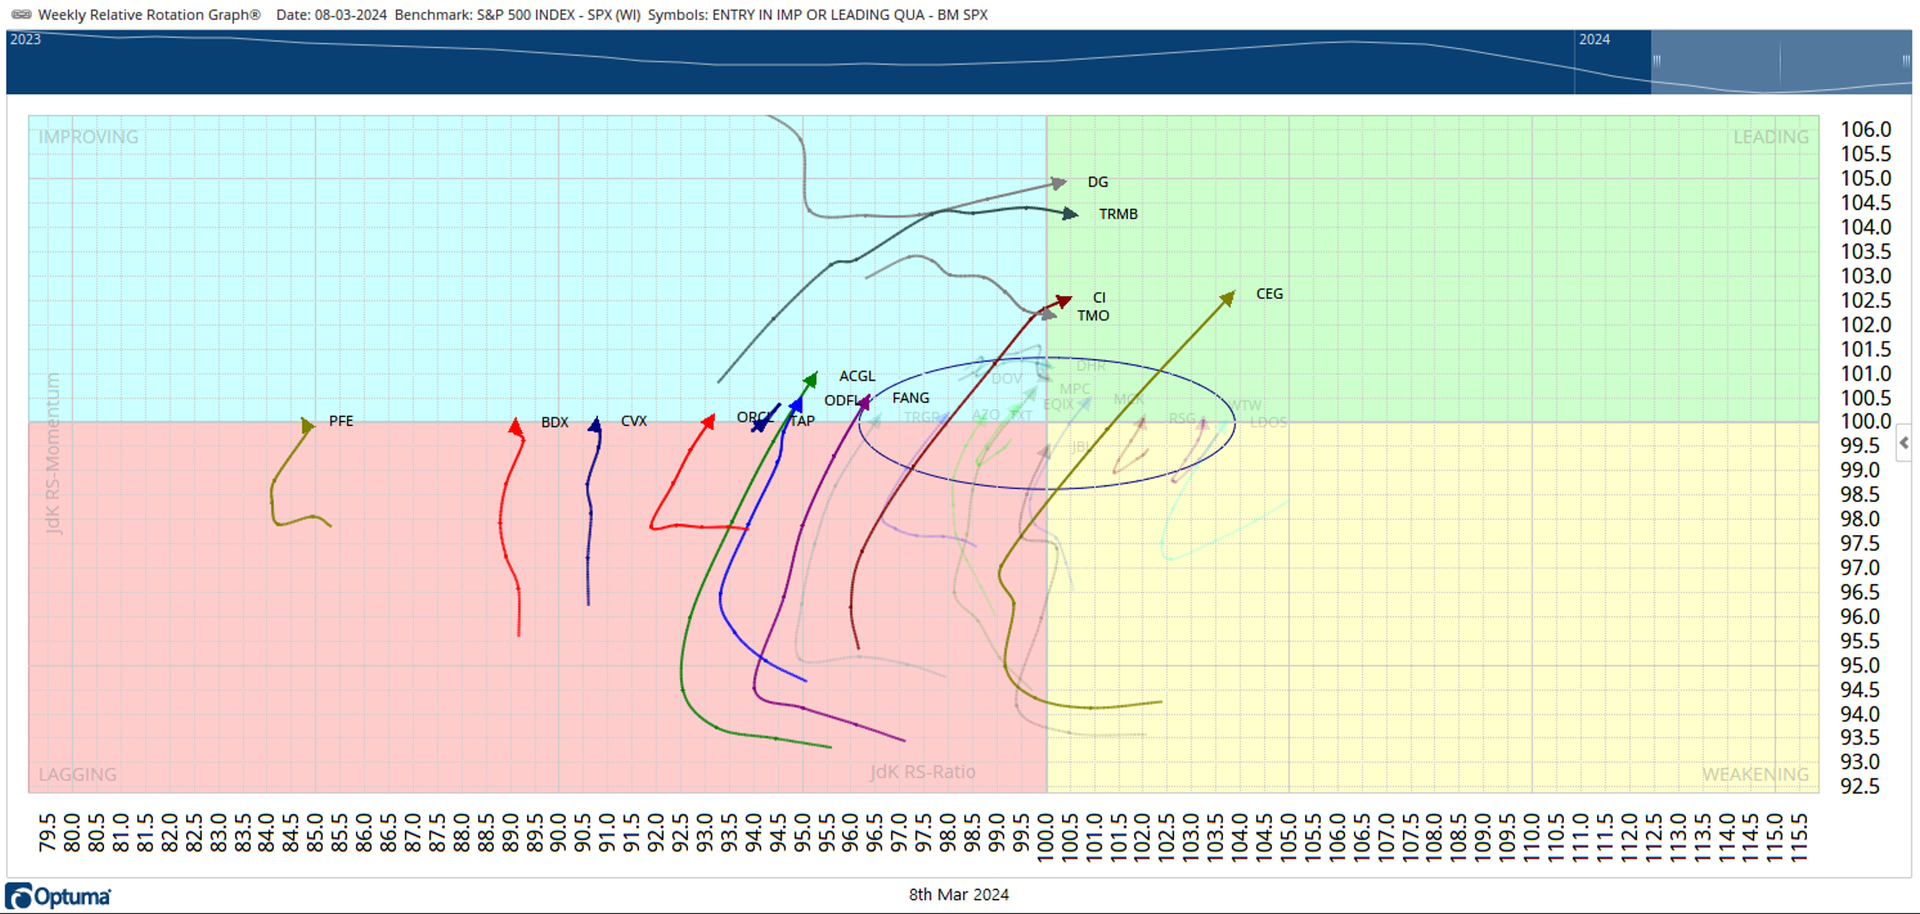
Looking Opportunities for there Generation Through Quadrant Crossovers |
RRG Quadrant crossovers provide an important insight when one is looking for the presence of Relative Strength. It helps us find those stocks where when coupled with good chart setups, one can find alpha-generating opportunities. In the above chart, we scan for Quadrant Crossovers. To find incremental alpha, we have further filtered the scan results by 1.0 standard deviation. As a rule of thumb, the larger the distance of the stock from the center, the greater the alpha it is likely to generate. Out of these many candidates, we pick up three stocks that show a good technical setup on the charts. With just one day to go before the week ends, this setup is very less likely to change. |
|
|
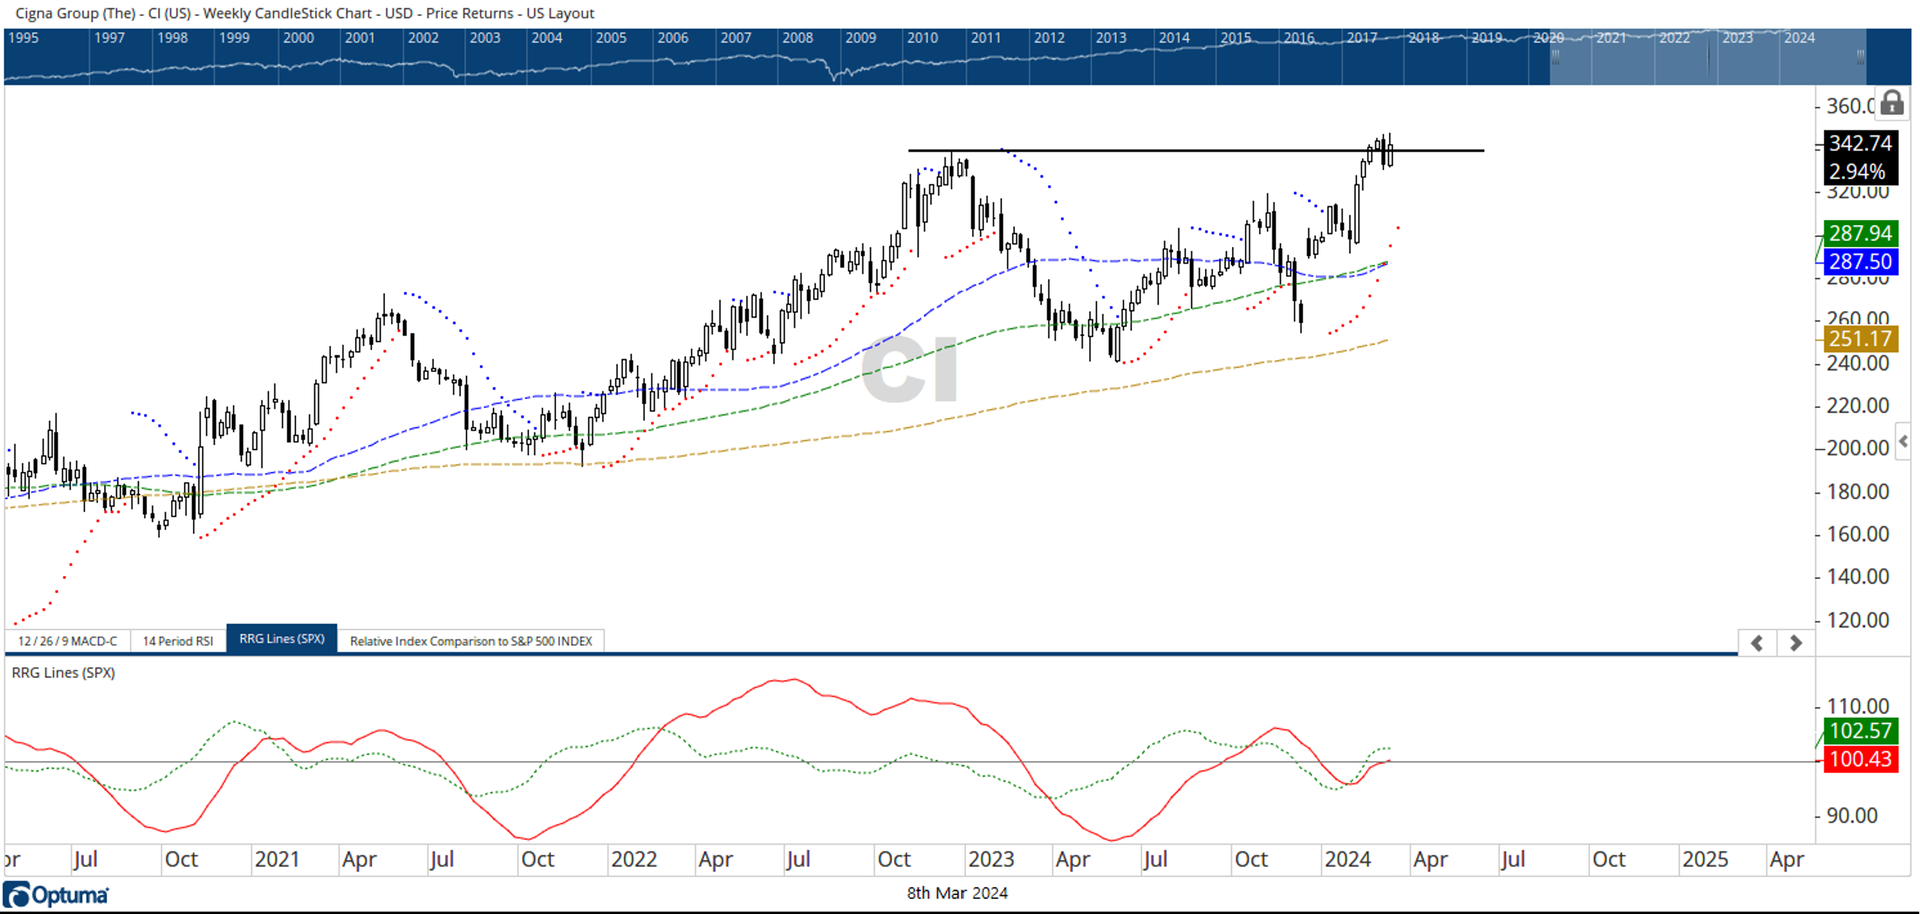
Multi-month Breakout in CI |
The high of 340 that was first tested in December 2022 is being tested again. CI marked a classical double top resistance earlier this year. After a brief consolidation, the stock is staring at a potential breakout. While tracking the upper band, the prices are seen inching higher, it has closed a notch above the crucial resistance point on Thursday. The RS line against the broader S&P500 index is inching higher; it has crossed above the 50-period MA. If the breakout happens on the anticipated lines, the stock can go on and test 365-390 levels over the coming weeks. |
|
|
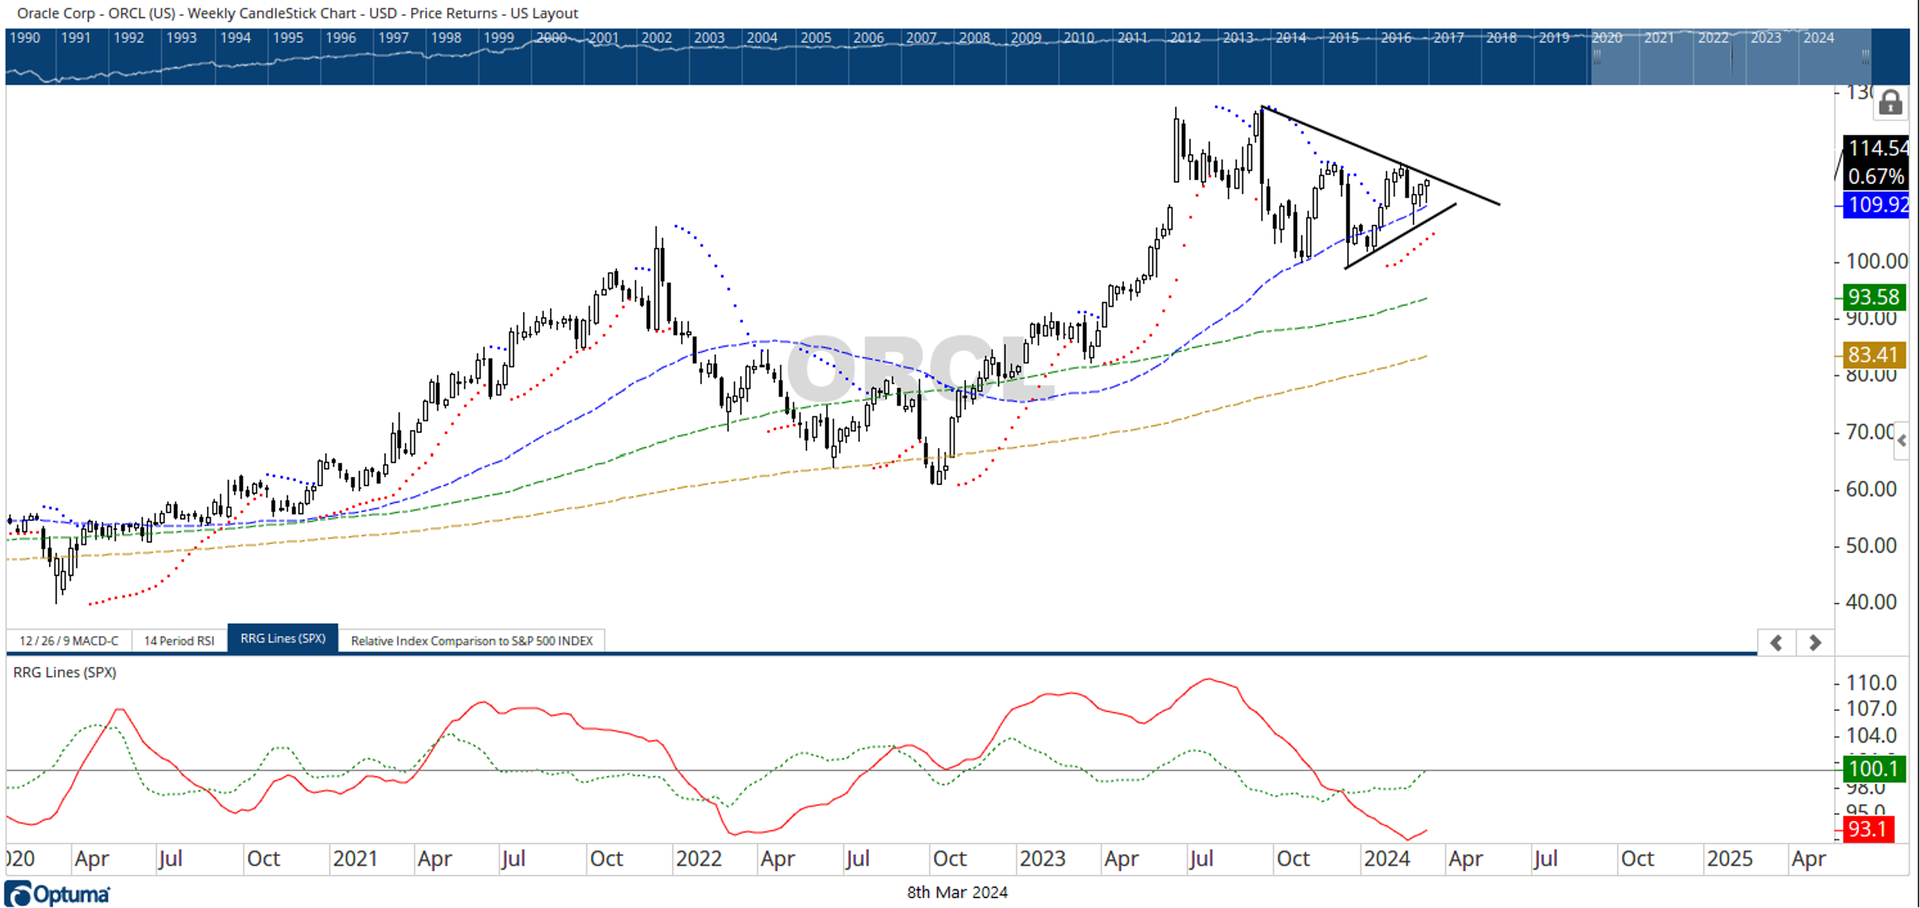
ORCL Staring At a Meaningful Upmove |
The price action in ORCL over the past five months has led to the formation of a symmetrical triangle on the charts. Though symmetrical triangles are neutral formations, most of the time they end up acting as continuation patterns which generally resolve with a continuation of the prior trend. Though price confirmation is always required, a few signs appear that shows that the stock is likely to resume its upmove. The RRG has seen a quadrant crossover; the stock has rolled inside the improving quadrant of the RRG which is a sign of a potential beginning of a phase of its relative outperformance. While the stock stays in this formation, it has consistently taken support on its 50-period MA which is seen almost acting as its proxy trend line. OBV hovers near its high point. |
| |
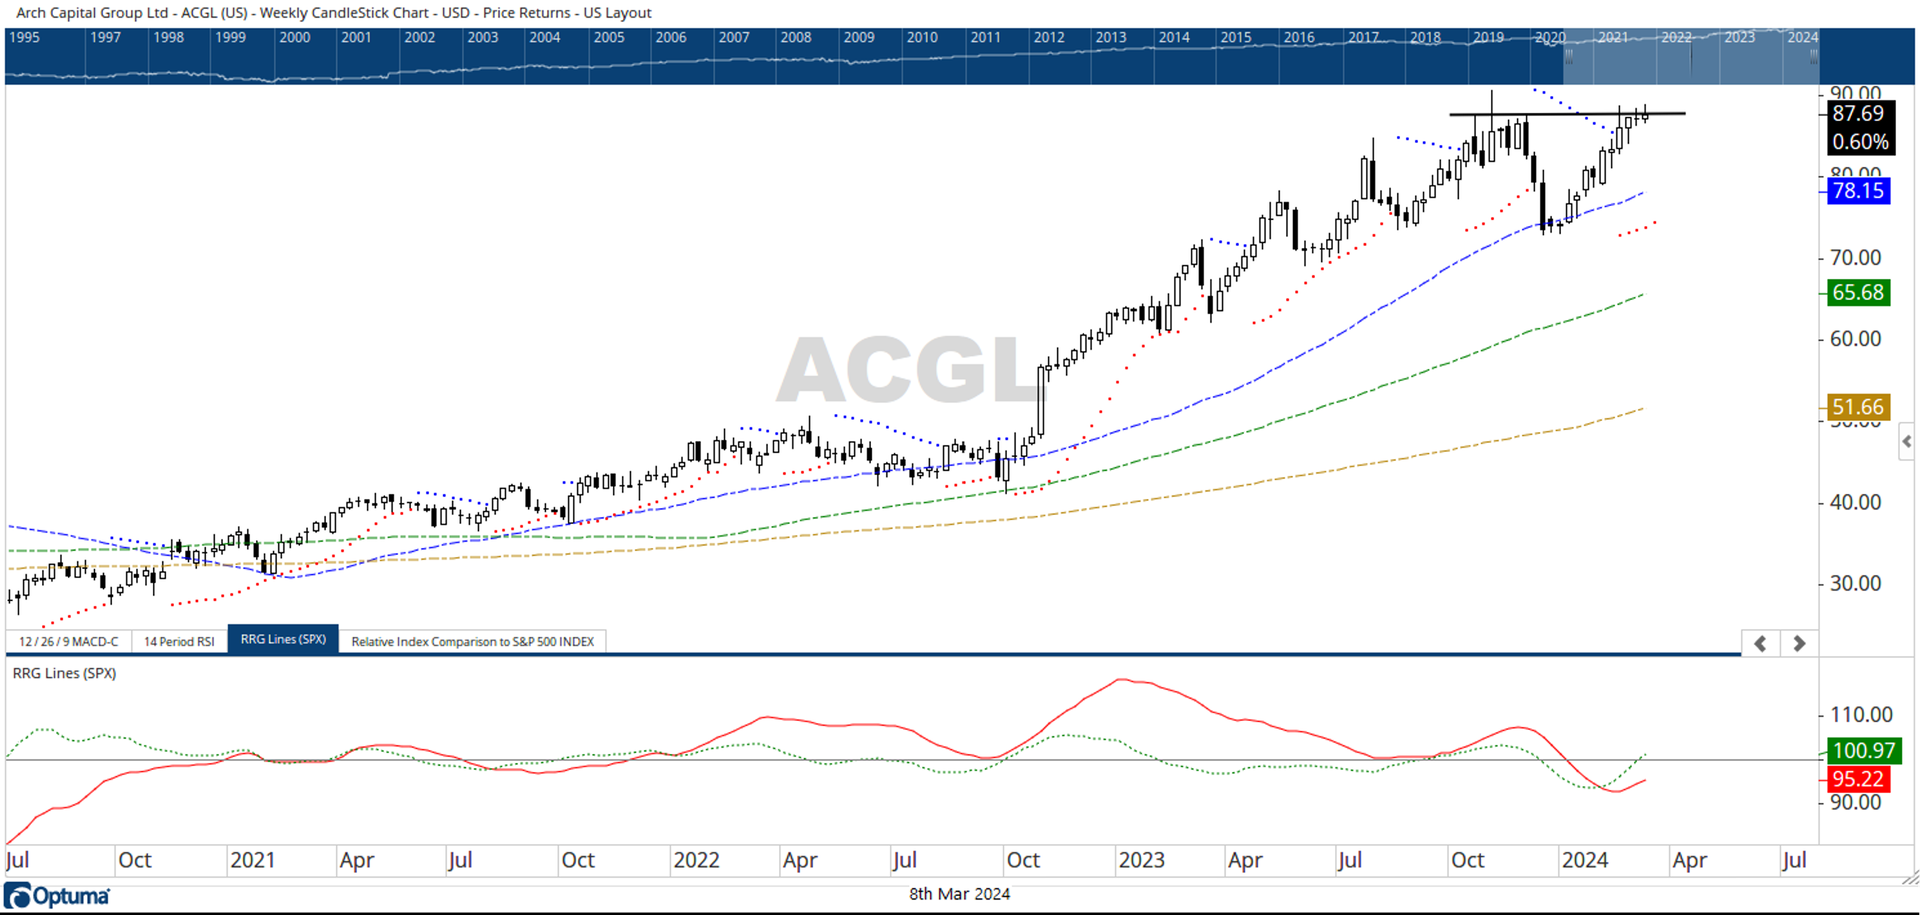
While some brief consolidation cannot be ruled out, ACGL too is staring at a fresh breakout. This stock has largely stayed in an uptrend; intermittent corrective retracements have found support at its 50-, and 100-week MA. Recently, the stock saw a strong rebound from its 50-week MA and is seen testing the prior highs. This stock has also rolled inside the improving quadrant of the RRG. This indicates the beginning of the relative performance of the stock against the broader markets. While the actual price breakout is yet to take place, OBV has already made a new high indicating strong accumulation and participation of volumes in the move. An expected resolution of the current setup has the potential to take the stock higher towards 93 and 96 levels over the coming weeks. |
| |
You are receiving this newsletter because you subscribed to the Chart Advisor newsletter. If you wish to unsubscribe, please click here. Dotdash Meredith 225 Liberty St, 4th Floor, New York, NY 10281
© 2024 All Rights Reserved. Privacy Policy | Terms of Service |
|
|
|