By C. Theodore Hicks II, CFP®, CKA®, CMT®
|
|
|
2/ Equal-Weights Out-Performing |
3/ Small-Caps Out-Performing |
4/ Mexico Out-Performing the US |
|
|
Investopedia is partnering with CMT Association on this newsletter. The contents of this newsletter are for informational and educational purposes only, however, and do not constitute investing advice. The guest authors, which may sell research to investors, and may trade or hold positions in securities mentioned herein do not represent the views of CMT Association or Investopedia. Please consult a financial advisor for investment recommendations and services. |
|
|
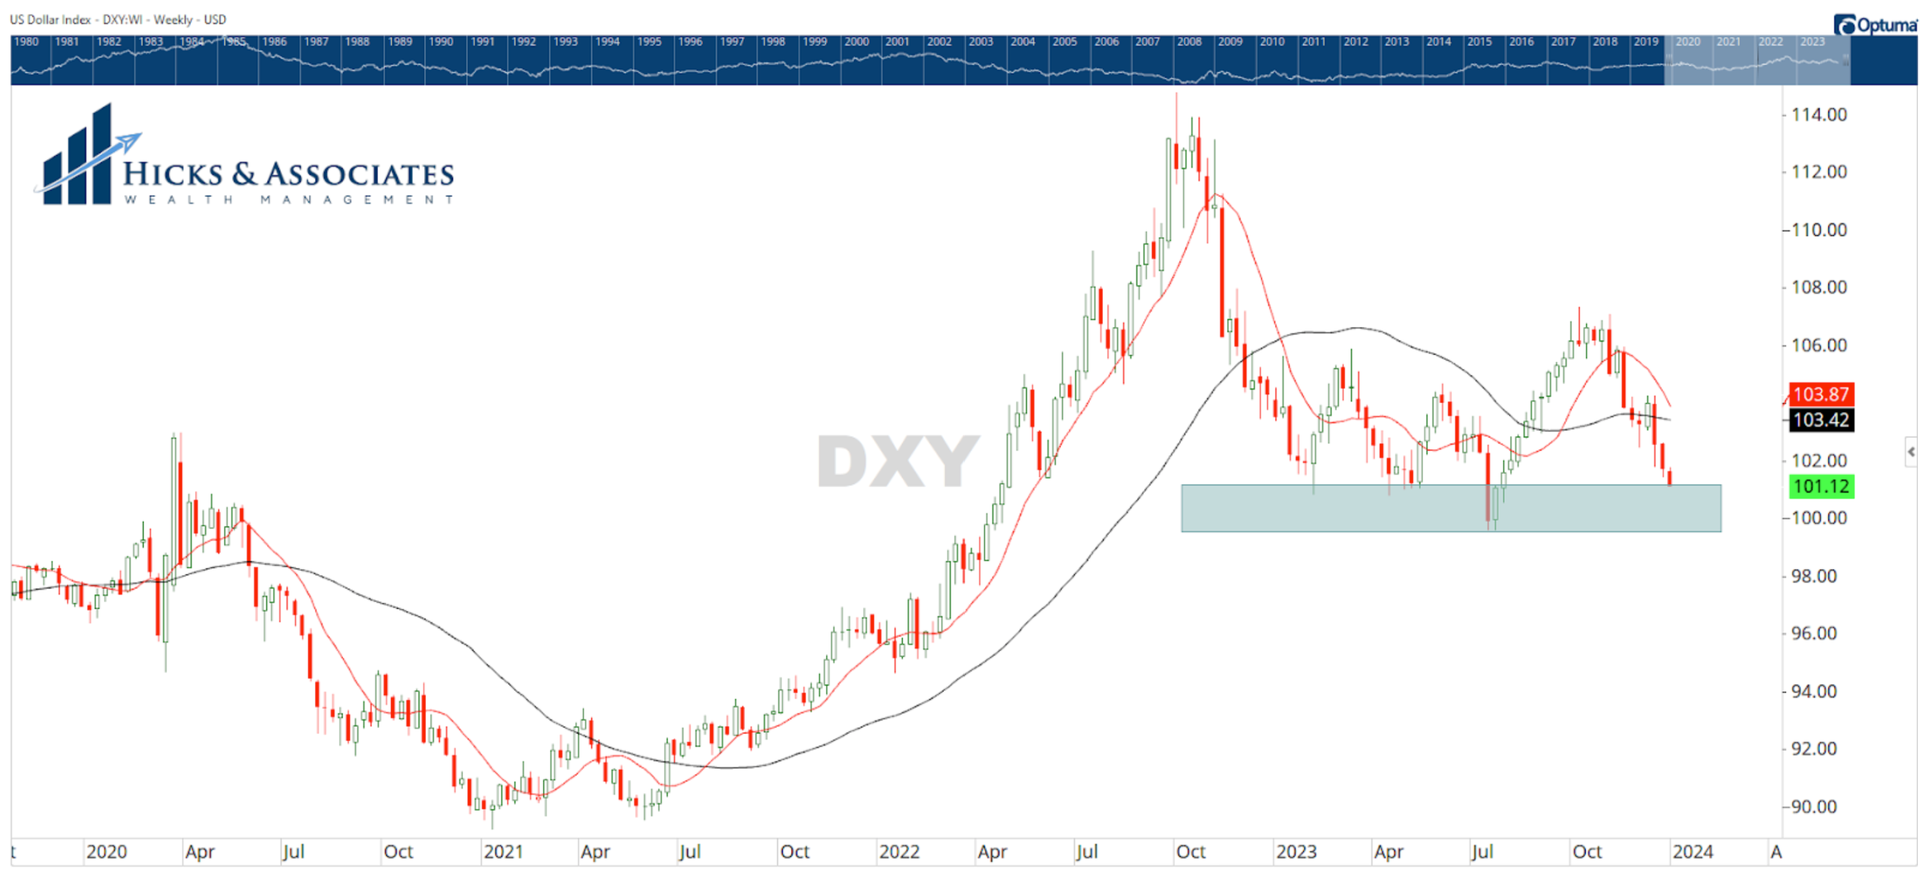
Chart 1 is the weekly chart for the US Dollar Index. The dollar has been falling the last couple of months. Since the dollar is generally inversely correlated to the US stock market, the dollar’s decline has been a help to US stocks. However, I’ve added a light blue rectangle to the chart. This highlighted area is where the dollar has previously found support. Note how price has just come into the top end of a support zone. As a result, it would be reasonable to see a rally in this index. If the dollar does rally off this level in the coming days, it would therefore be reasonable to see a concurrent selloff in the US stock market. If those two things happen, we will simply analyze the data and determine if our macro-view has changed or is it simply a correction within a trend. |
|
|
Financial market research from professionals at the forefront of technical analysis innovation. |
|
|
Equal-Weights Out-Performing |
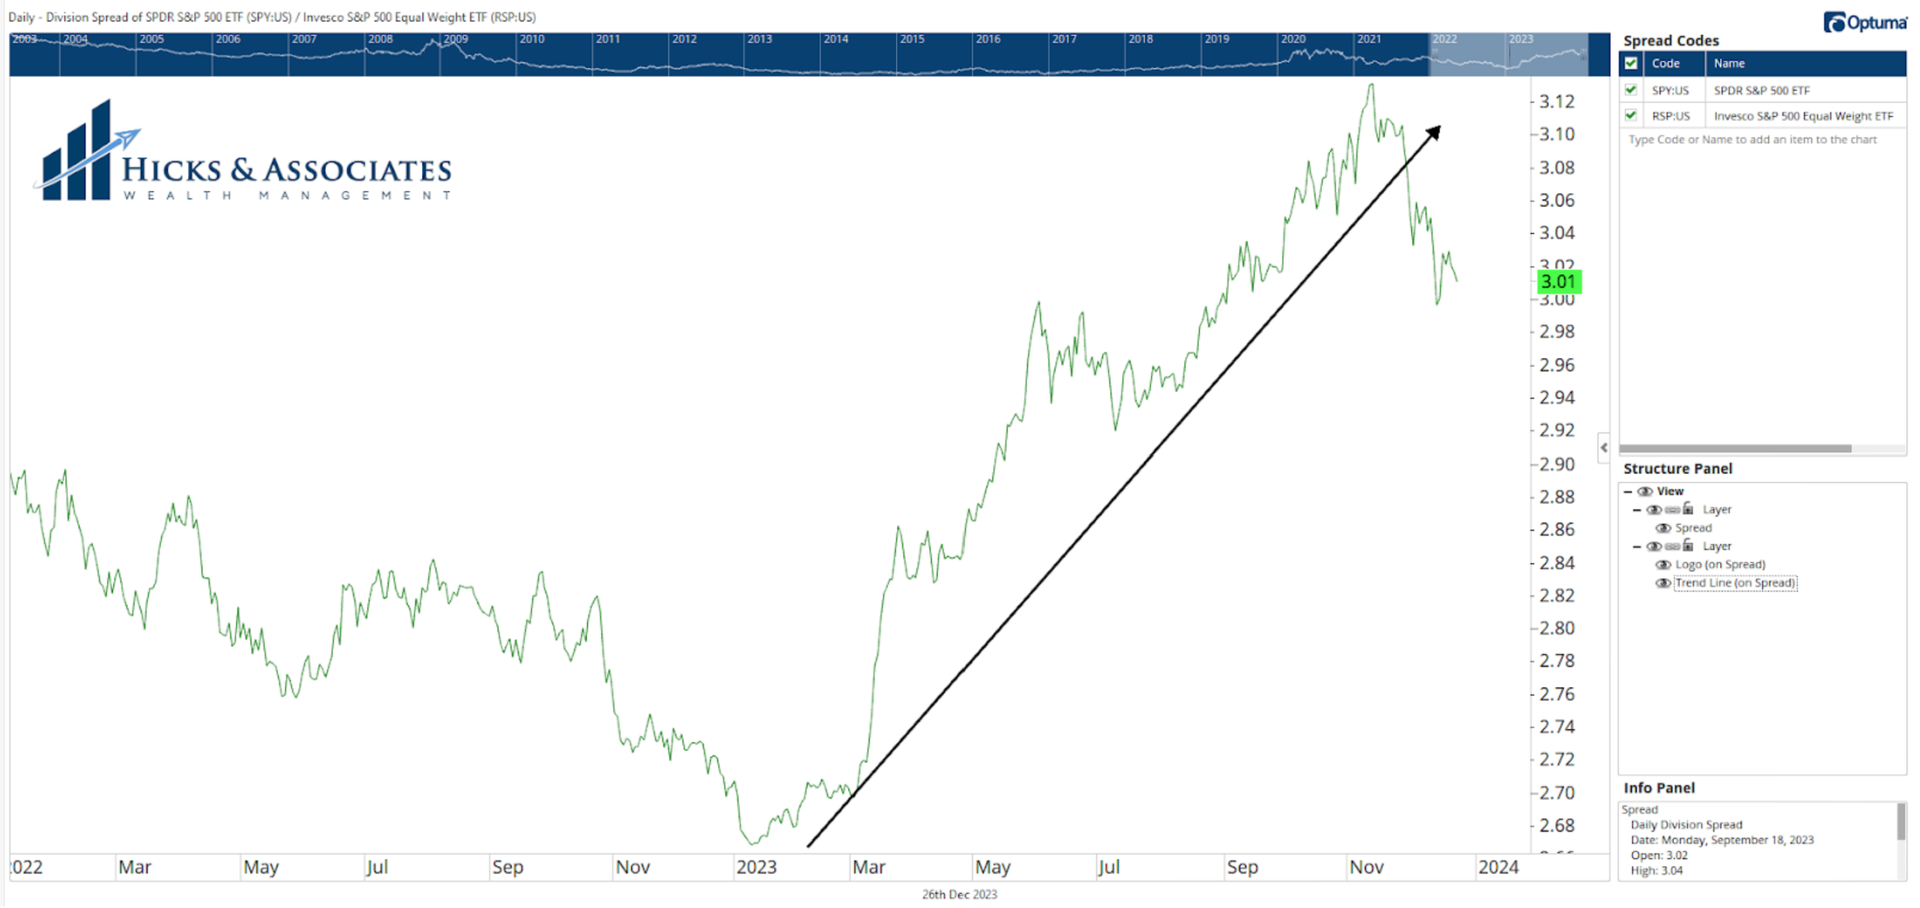
The next three charts are called “division spread” charts. To create one of these charts we simply take two different ticker symbols and divide one into the other. The chart then “points” to the stronger of the two. This is one way to measure “relative strength”. (You can learn more about Relative Strength in this Investopedia article.) In Chart 2 we have SPY as the numerator and RSP as the denominator. SPY represents the S&P 500 and RSP is the equal-weight version of the same stocks. We can see that for the majority of 2023, this division spread chart was pointing to the numerator indicating that SPY was the stronger of the two. However, the chart changed directions in mid-November. Since then, the equal-weight S&P 500 (RSP) has been the stronger of the two. This is good news. One of the biggest problems of 2023 was the lack of “breadth”, which is a fancy way of saying that there just were not a lot of stocks participating in the S&P 500’s advance this year. Chart 2 is one of the ways we see that this has started to change. Chart 2 is saying that it is no longer just The Magnificent Seven that are advancing. |
|
|
Small-Caps Out-Performing |
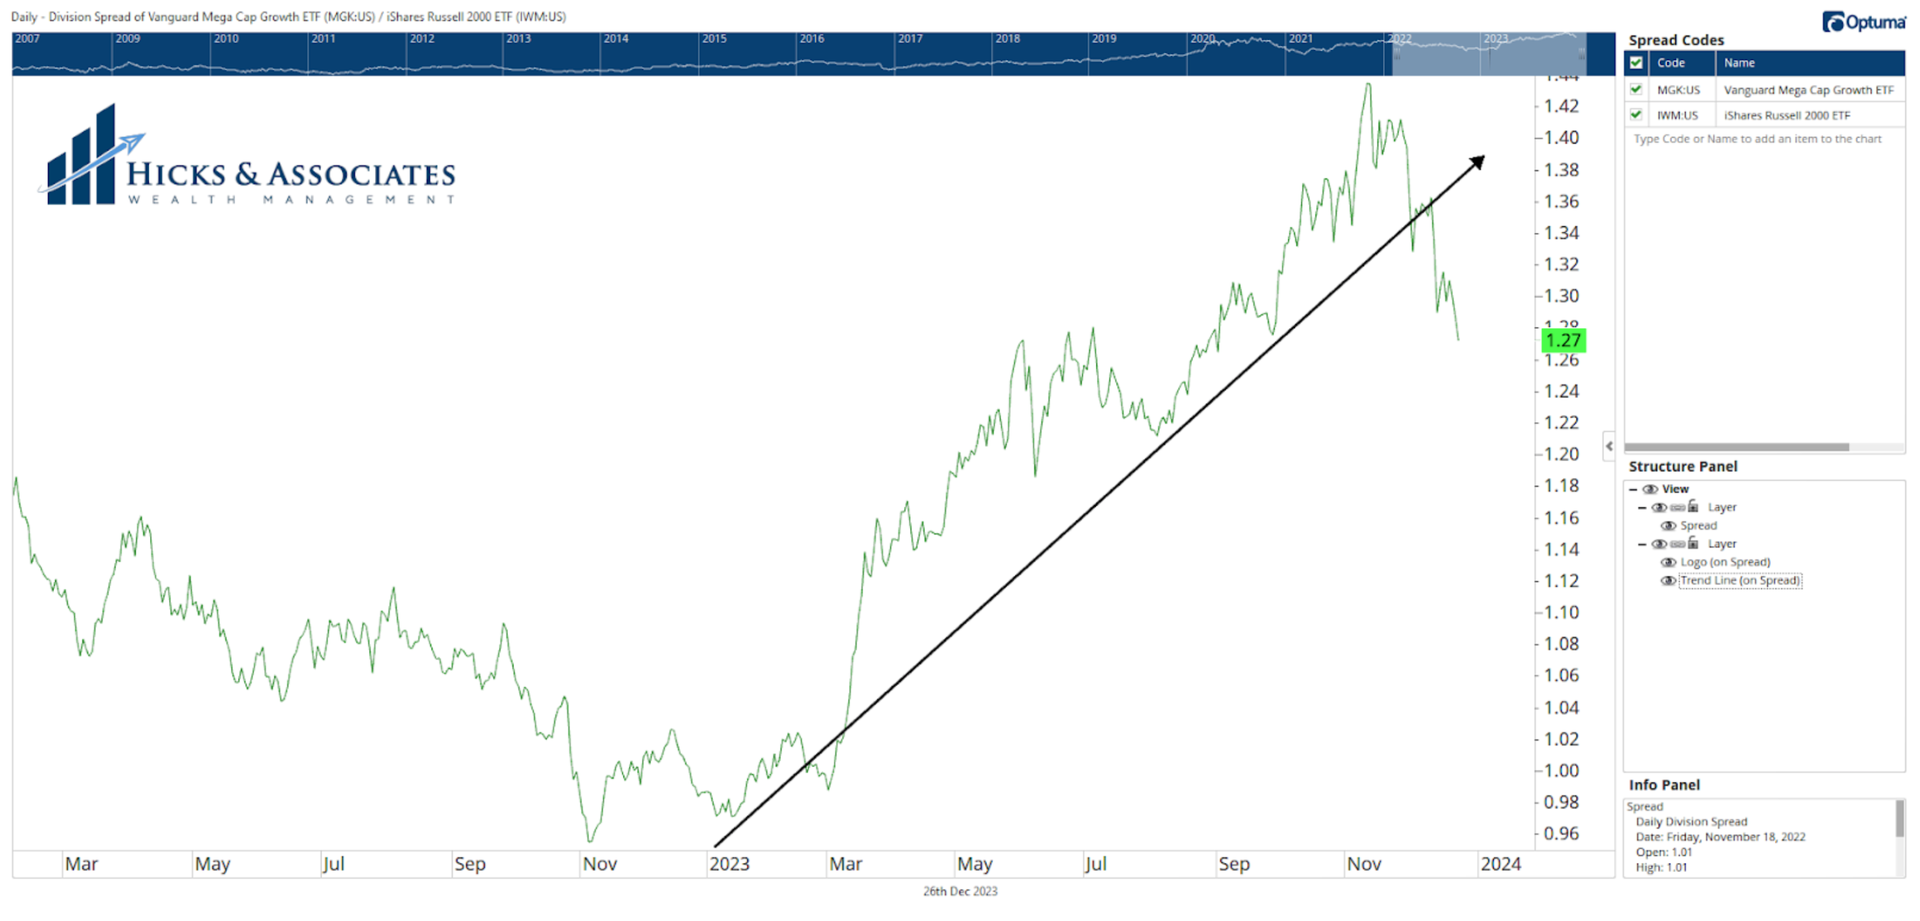
Chart 3 takes this concept one step further. Here we have the Mega-Cap ETF (MGK) in the numerator and a Small-Cap ETF (IWM) in the denominator. We see the same basic pattern. For the majority of 2023, the mega-cap stocks were clearly the stronger of the two. However, that trend has changed and we now see that Small-Caps have been out-performing. Again, a good sign as it demonstrates that we are seeing more and more stocks participate in the rallies. |
| |
Mexico Out-Performing the US |
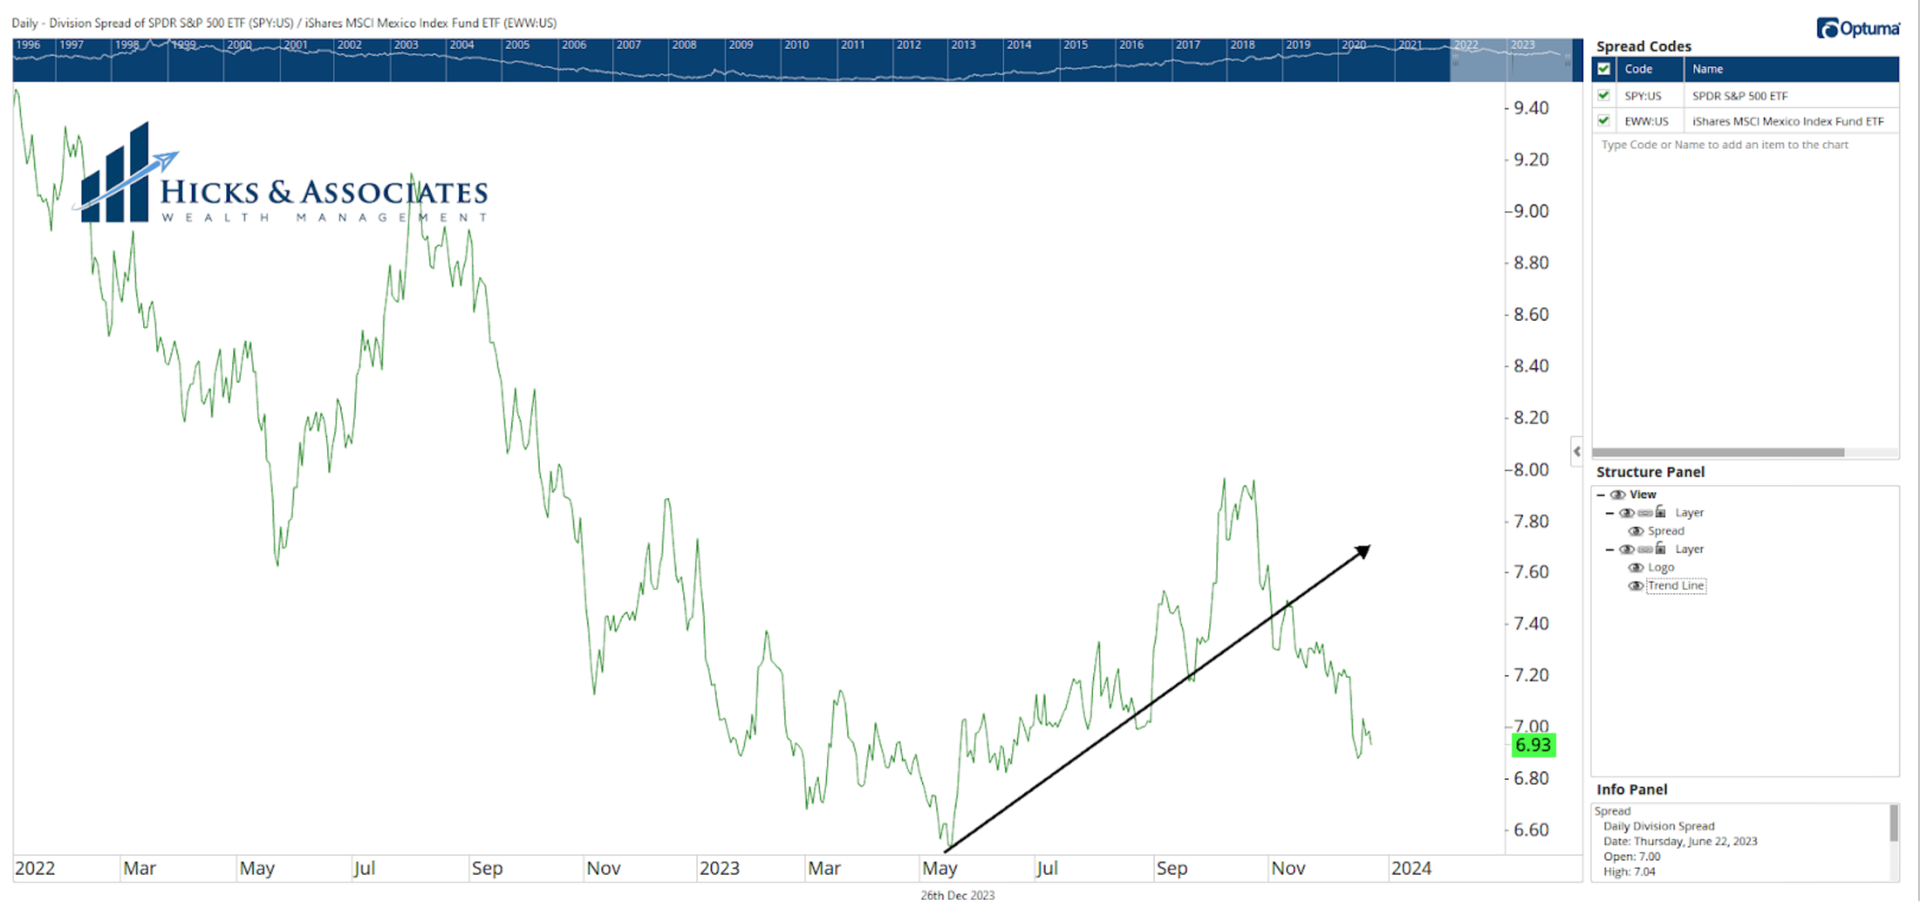
Our final chart of the day is to add a little international flavor to the conversation. Perhaps I’m also adding it because it is cold & rainy in North Carolina while I write this and I’m thinking of a vacation in sunny Mexico? Maybe. Personal vacation musings aside, Chart 4 has the S&P 500 (SPY) in the numerator and the iShares Mexico ETF (EWW) in the denominator. The same basic pattern emerges, though not as pronounced. The US stock market was relatively stronger than the Mexican stock market, but that has not been true lately. |
|
|
Theodore Hicks, CMT is the Founder and Chief Investment Officer for Hicks & Associates Wealth Management, an SEC Registered Investment Adviser. Hicks and his team manage money for families and retail clients using a proprietary, multi-strategy investment process through a rules-based framework. Since most of their clients are either near or already in retirement, the process is designed to minimize downside risk. Hicks frequently posts charts and his thoughts to his LinkedIn and Twitter accounts. |
|
|
You are receiving this newsletter because you subscribed to the Chart Advisor newsletter. If you wish to unsubscribe, please click here. Dotdash Meredith 225 Liberty St, 4th Floor, New York, NY 10281
© 2023 All Rights Reserved. Privacy Policy | Terms of Service |
|
|
|