Investopedia is partnering with CMT Association on this newsletter. The contents of this newsletter are for informational and educational purposes only, however, and do not constitute investing advice. The guest authors, which may sell research to investors, and may trade or hold positions in securities mentioned herein do not represent the views of CMT Association or Investopedia. Please consult a financial advisor for investment recommendations and services. |
|
|
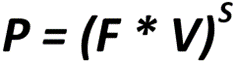
Technical analysis has been given many definitions over the past 100 years, beginning with Charles Dow in the late 1800s. “The study of supply and demand” is perhaps the most commonly used of all definitions. Charles Dow spoke about the drivers of supply and demand, and importantly, how those drivers changed depending on which timeframe one was looking at. Specifically, Dow talked about how long-term price trends are determined by long-term fundamental trends, while short-term price trends are driven by emotional responses to those fundamental trends. Throughout my career, I have had the great fortune of working with some of the best fundamental managers in the business, and my challenge has always been helping them to discover how they can use technical analysis—trend following and momentum, in particular—to deliver better results for their investors. Of the many concepts that I have developed over the years to help illustrate Dow’s point about the link between fundamentals and trend, the following formula has been perhaps the most effective: |
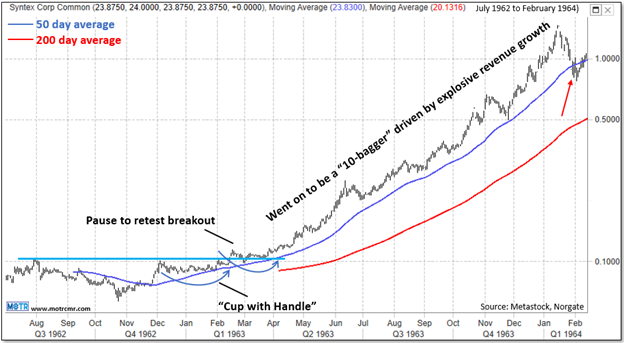
In this formula are the three styles of investing: Price (technical), Fundamental (growth, returns, leverage, etc.), and Value (I’ll get to the “S” in a moment). The simplicity of this formula demonstrates Dow’s point beautifully, in that whatever happens on the right side of this formula, the left side will respond in kind. Good things on the right side lead to good things on the left, and vice versa. However, it is also just as true that no matter what a fundamental investor believes about the right side of this formula, he or she will never make money on that opinion, long or short, unless the market (P) agrees. In bull markets, confidence steadily increases, driving fundamental forecasts higher and higher, and encouraging investors to pay higher and higher valuations. This is the “S” in the formula, or sentiment. In bull markets, that “S” is some whole number above 1, while in bear markets it is a fraction somewhere between 0 and 1. We can think about S=1 as being perfectly rational, a state the market hardly ever achieves. In the end, P represents the market’s rather learned opinion about all the things happening on the right side of the formula. This opinion includes everything we know we know, everything we know we don’t know, but most importantly, everything we don’t even know that we don’t know. It is for this very reason that the market is so hard to beat. In the end, it is my opinion that the market is the best fundamental analyst on the planet, and by listening to price, a fundamental investor can “hire” that top ranked analyst onto his or her team. William O’Neil, famed trend following investor and founder of Investor’s Business Daily, knew all to well about the power of combining trend and momentum with explosive fundamental growth. He is famous for many high performing investments, but one that really put him on the map and earned him the capital to launch his businesses was Syntex Corp. He bought this pharmaceutical company in the early 1960s, as it was emerging from a clear base and ”cup with handle” pattern. This stock went on to become a “10-bagger” before finally breaking its 50-day average (red arrow). |
After breaking its 50-day average, the stock declined nearly 60% before building a multi-year base that eventually set the stage for yet another “10-bagger” run in the 1980’s. I will speak to this a bit more in my remaining articles this week, but for a trend follower looking for “multi-baggers”, the advice from O’Neil and many others to combine both trend (the market’s opinion) with fundamentals (the fuel for the rocket) should be considered seriously. As the formula at the outset of my article reveals, the better the F, which will drive V and S, the better the P. |
|
|
David Lundgren, CMT, CFA has more than three decades of investment industry experience, with a focus on technical analysis strategies, particularly momentum and trend following. He launched and Co-Hosts “Fill the Gap”, CMT Association’s official podcast and is a member of CMT Association’s board of directors. He has started several research and investment firms, including hedge fund Lyceum Capital, Breakaway Research, and most recently MOTR Capital Management & Research, Inc. |
|
|
You are receiving this newsletter because you subscribed to the Chart Advisor newsletter. If you wish to unsubscribe, please click here. Dotdash Meredith 225 Liberty St, 4th Floor, New York, NY 10281
© 2024 All Rights Reserved. Privacy Policy | Terms of Service |
|
|
|