1/ 11 Tests of 200-Week MA by Brent Crude |
3/ Where is Brent Oil Headed? |
4/ Precious Metal Stays Equally Strong |
5/ What Does Relative Strength Say? |
|
|
Investopedia is partnering with CMT Association on this newsletter. The contents of this newsletter are for informational and educational purposes only, however, and do not constitute investing advice. The guest authors, which may sell research to investors, and may trade or hold positions in securities mentioned herein do not represent the views of CMT Association or Investopedia. Please consult a financial advisor for investment recommendations and services. |
|
|
11 Tests of 200-Week MA by Brent Crude |
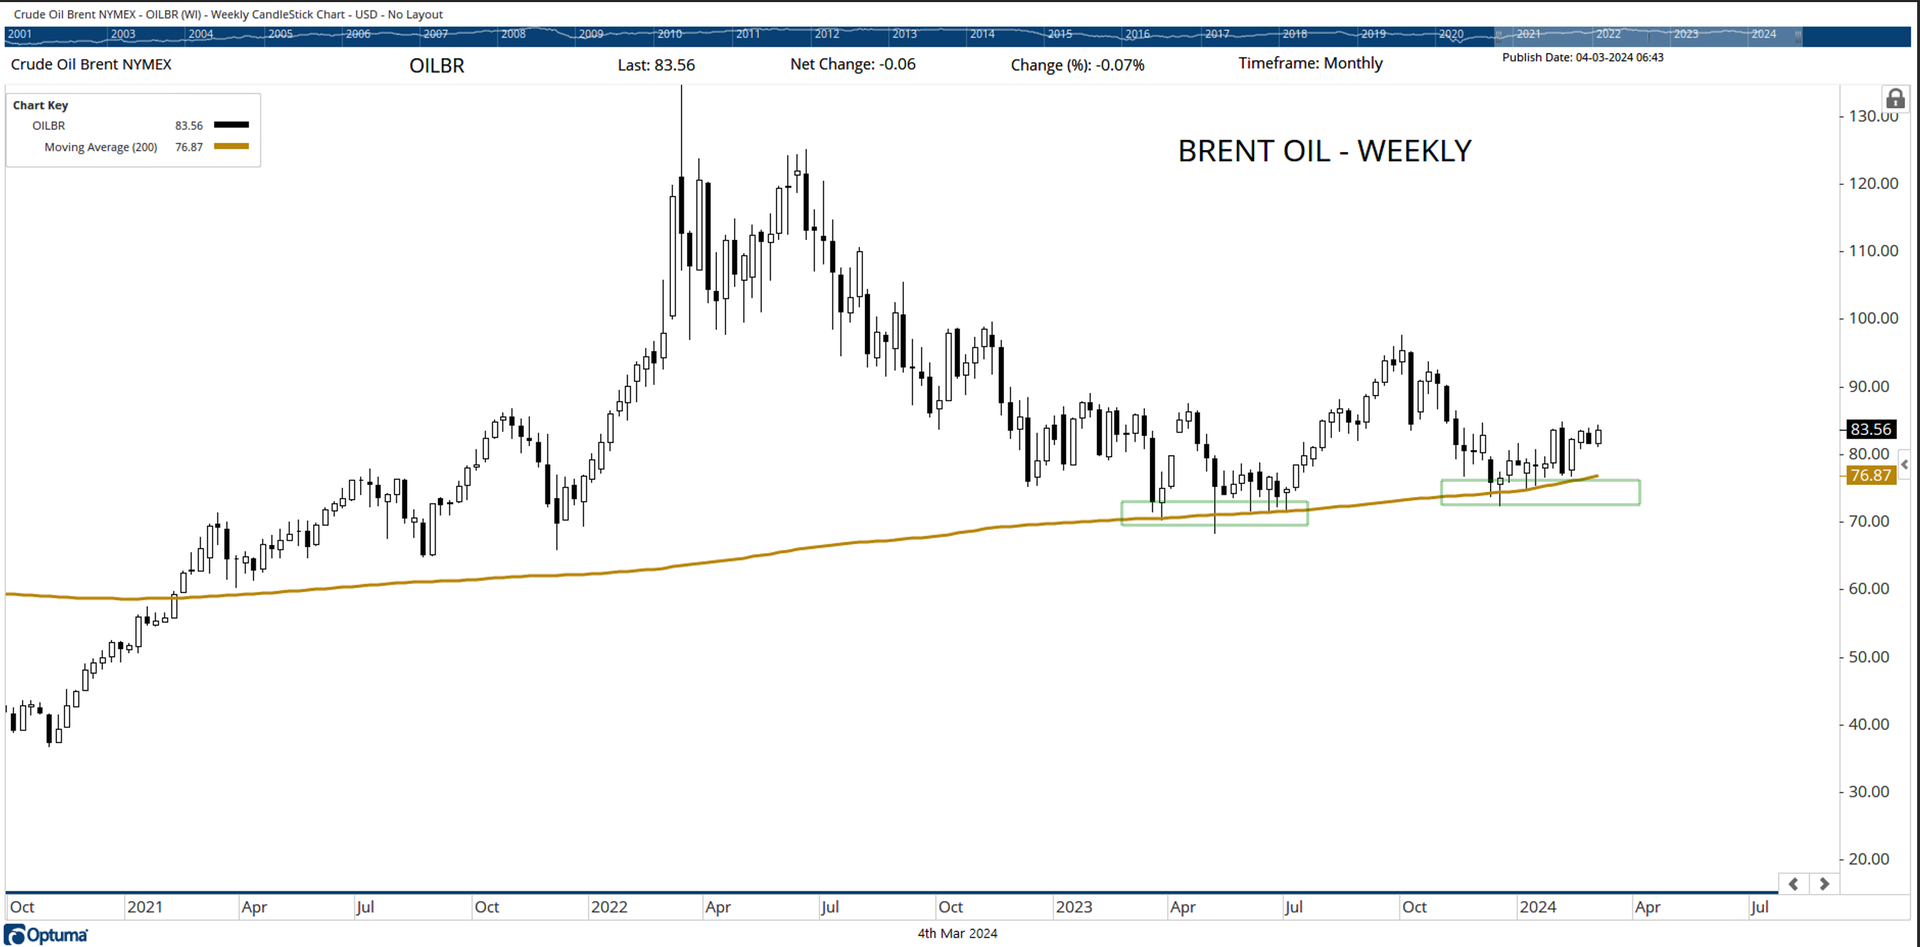
While major momentum and directional moves are expected from Brent Crude by analyzing crossovers of 10- and 40-period Moving Averages, the attempt to look at a larger picture reveals important technical events over the past 12 months. After testing the high of $ 125.18 in June 2022, a corrective decline followed. Subsequently, Brent tested and found support at the 200-week MA for the first time in March 2023. From that time until today over 12 months, Brent has tested 200-week MA over 11 times and has bounced back from there. The 200-week MA presently rests at $76.87. |
|
|
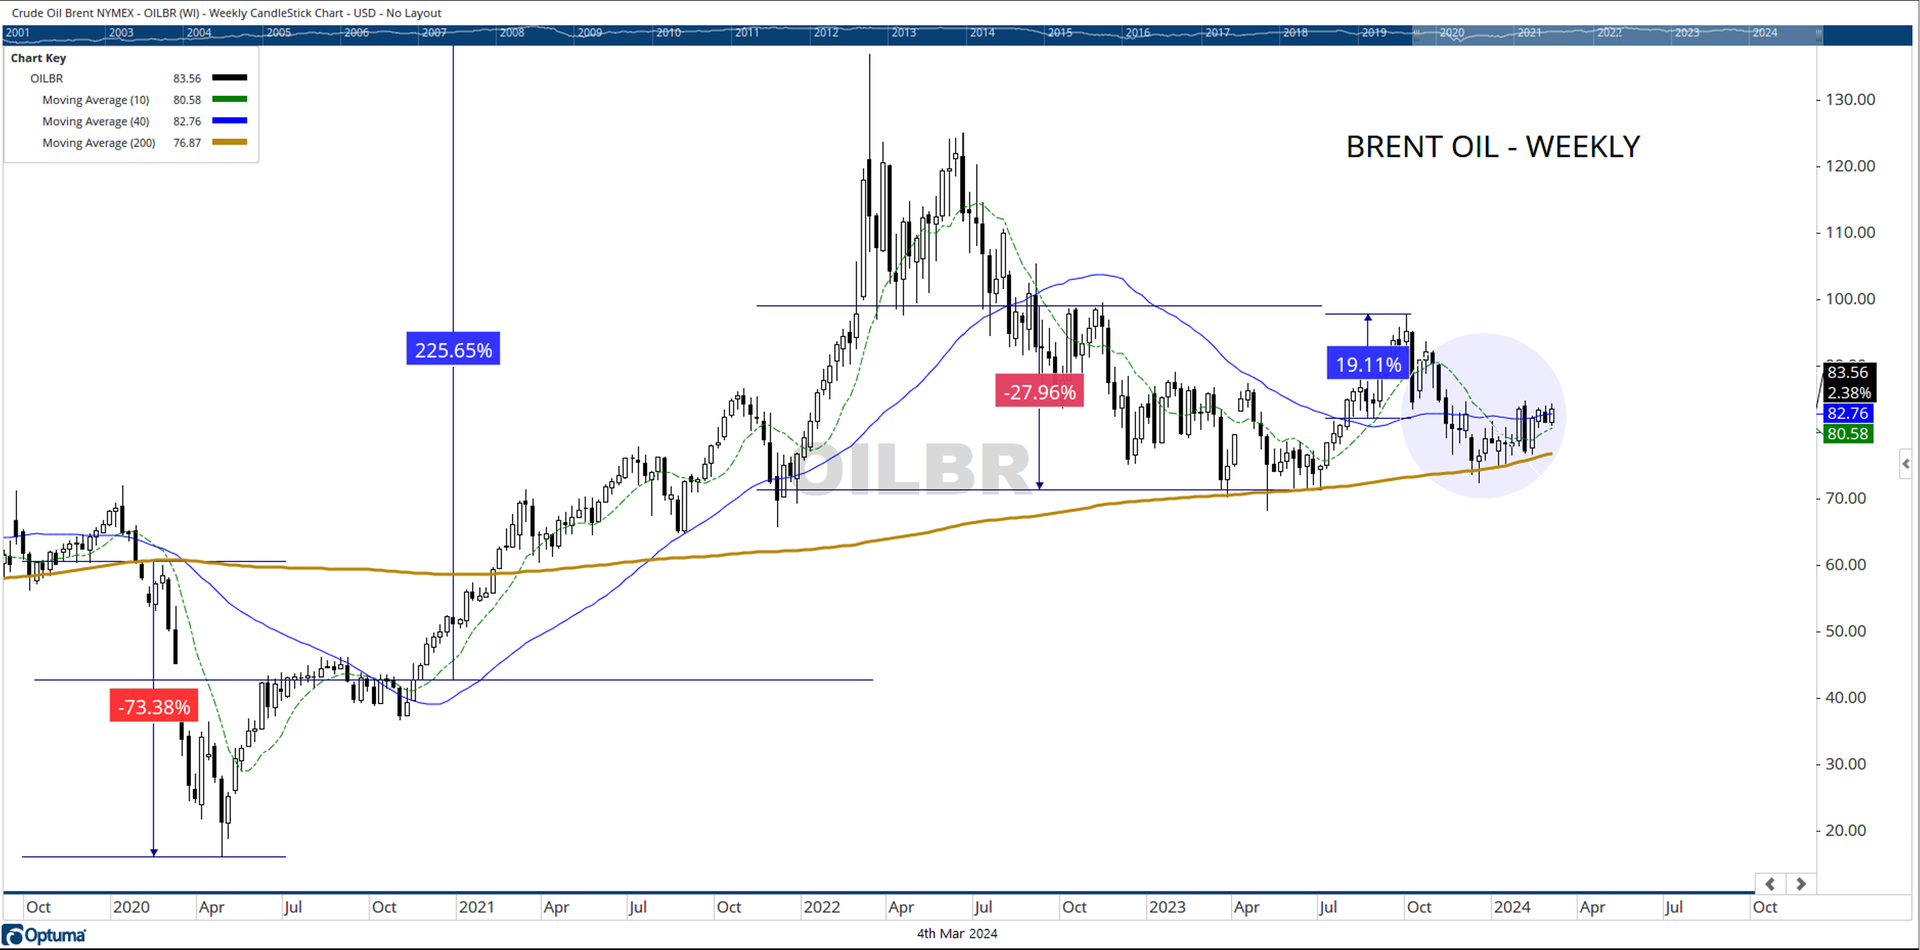
Even a casual glance highlights the importance of 10- and 40-week moving average crossovers. Each time when the 10-week MA has crossed above or under the 40-week MA, it has led to a significant directional move in the Brent prices. The moves have stayed in the range of 19% to 73% each time this has happened; the largest one was the post-COVID move which was that of a massive 225%. This outlier aside, it is beyond doubt the crossover of 10- and 40-week MA can fairly be relied upon to establish potential directional moves. However, at least as of now, the recent negative crossover of 10- and 40-week MA (i.e., 10-week MA crossing under 40-week MA) in December last year has failed to result in any directional downtrend. The reason for this is the existence of an all-important 200-week MA that has provided support at each time it was tested. |
|
|
Where is Brent Oil Headed? |
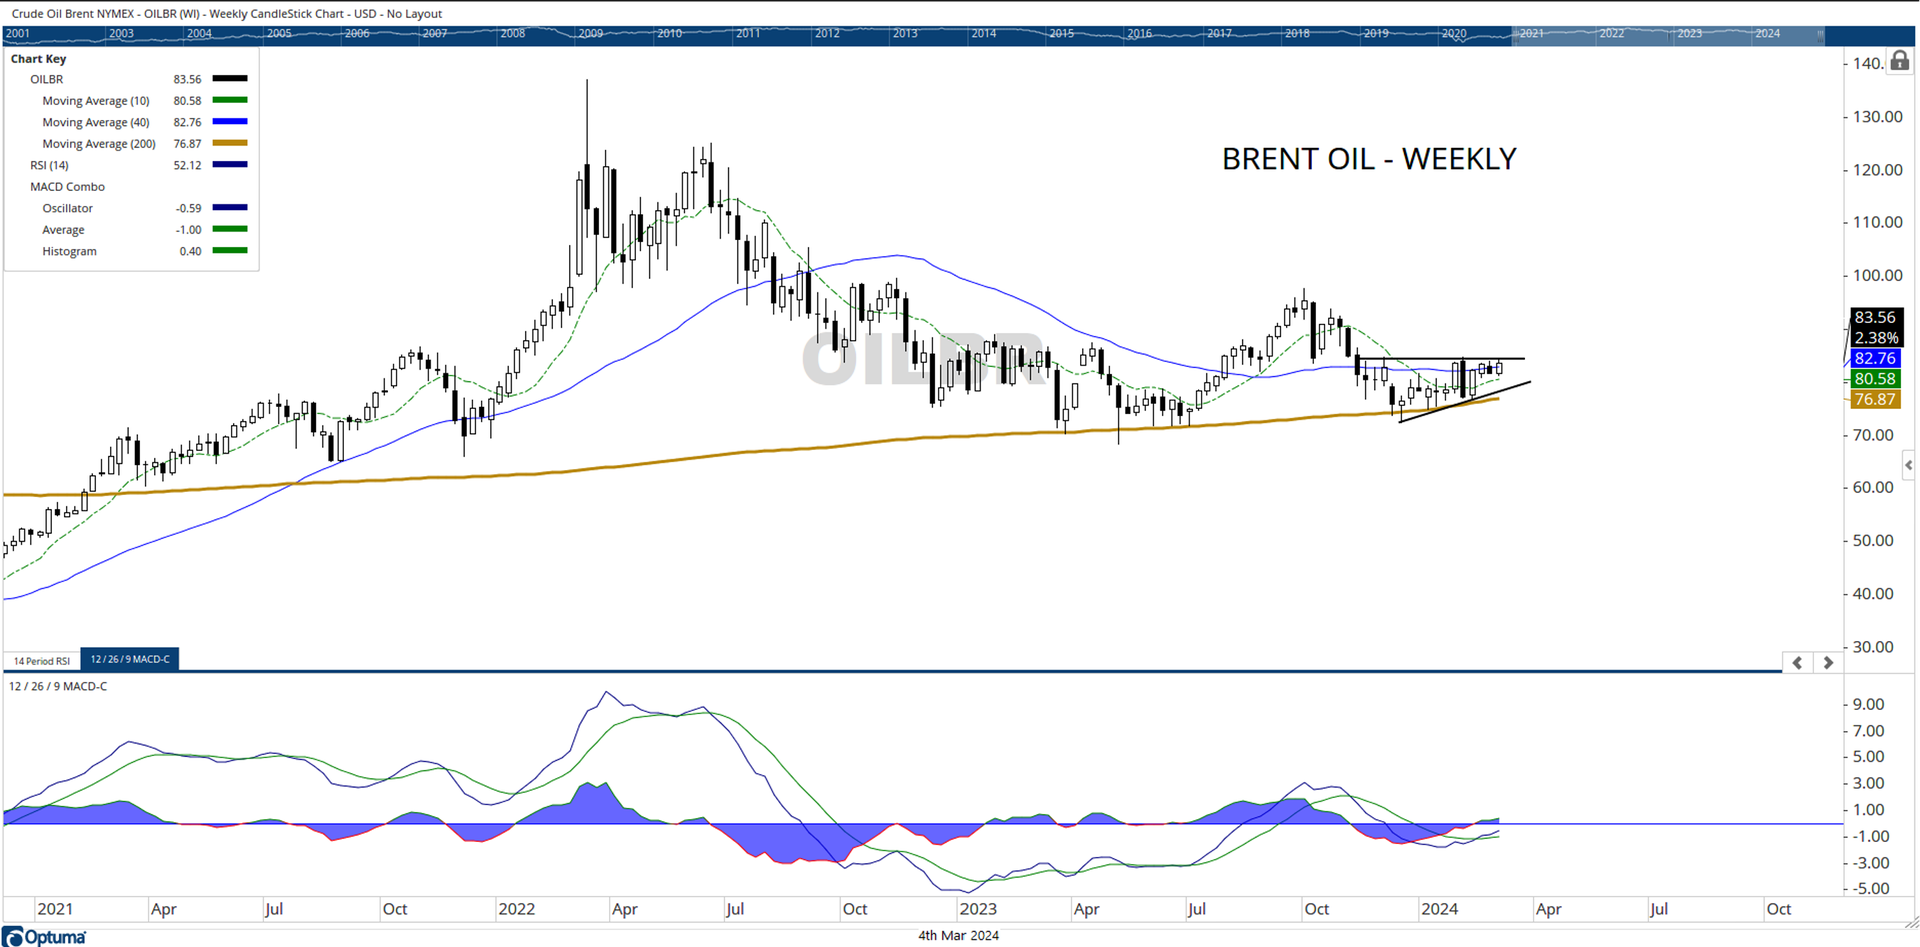
Although Brent has tested 200-week MA 11 times over the past 12 months, the price action over the past quarter has led to the formation of a small bullish ascending triangle. The lower edge of this technically bullish formation coincides with the 200-week MA which is currently placed at $76.87. Going by the classical price measurement implications, Brent can be expected to test $89-91 over the coming weeks. Any close below 78 will negate this technical setup. |
|
|
Precious Metal Stays Equally Strong |
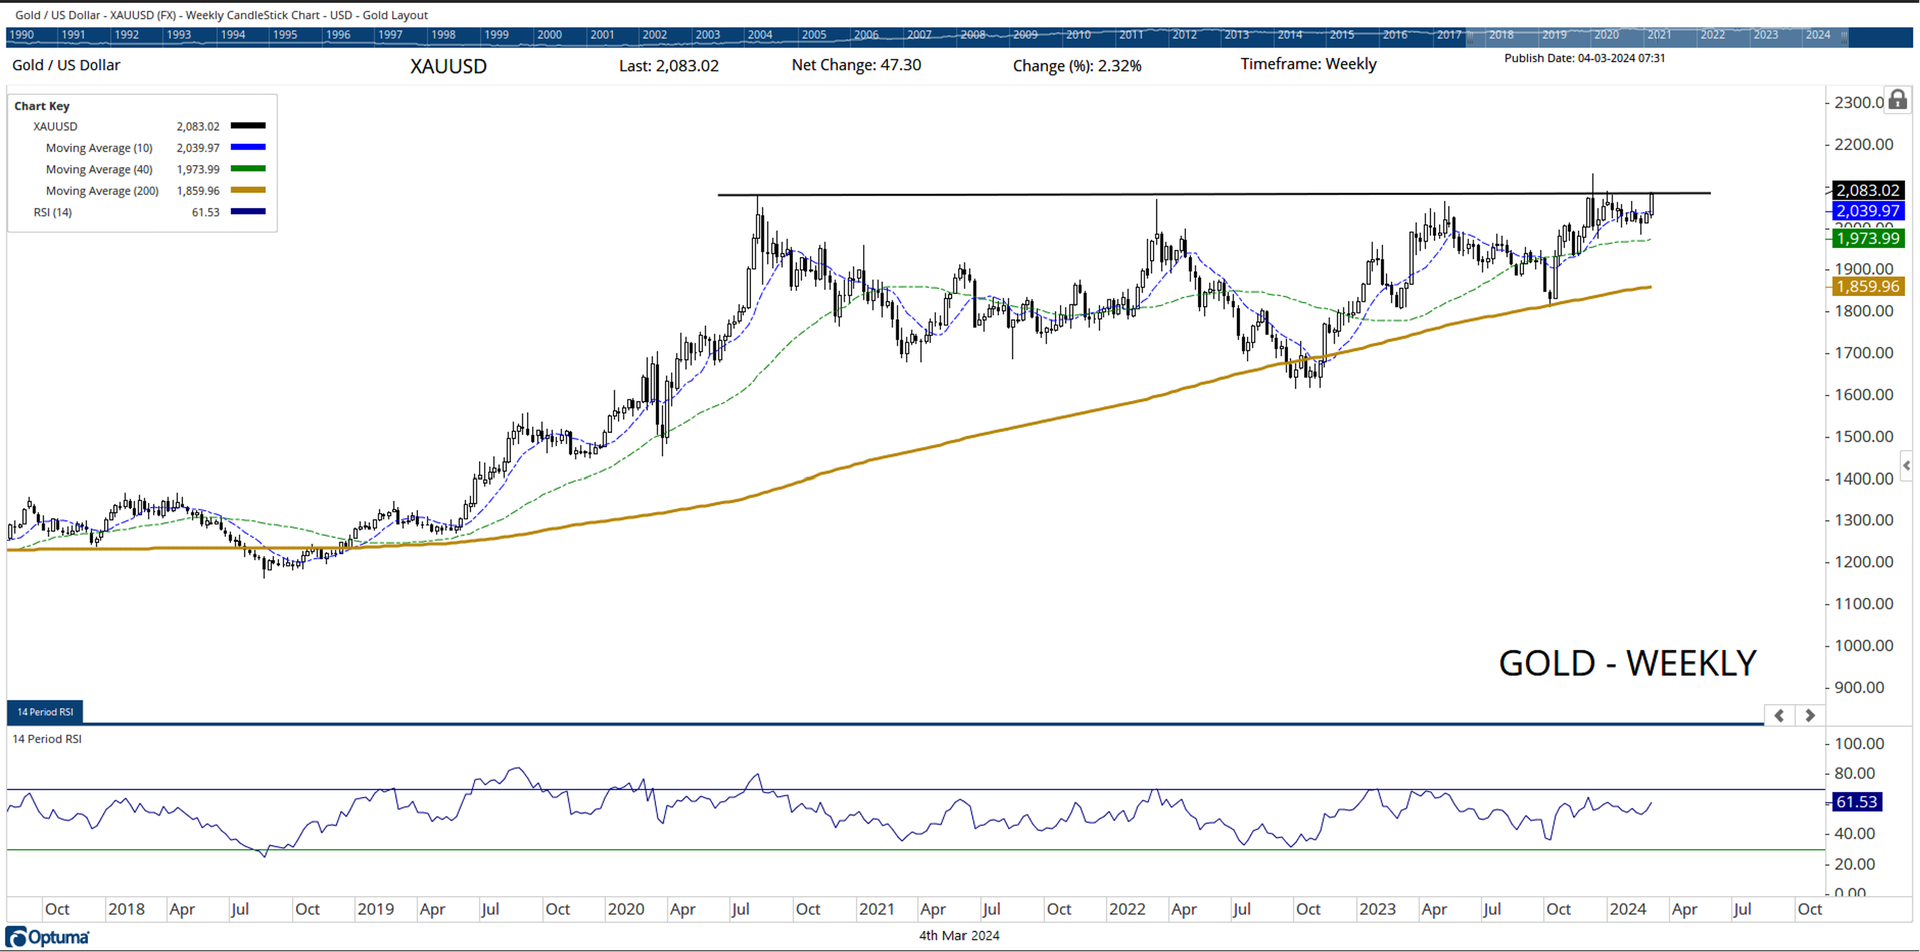
Gold (XAUUSD) has stayed much stronger over time as compared to crude Oil. From a technical perspective, the precious metal made a high at $ 2079 in August 2020; after this, the zone of $2050-2075 has been tested multiple times. Each time the precious metal went near this zone, it found strong resistance. Importantly, this level has been tested once again; Gold has closed at its weekly high and any thrust that takes the precious metal above $ 2085 will infuse further strength. The longer it stays above $2075-2085, the stronger the chances of it moving higher. However, in the event of any retracement, a move below $1975 will push the commodity under prolonged consolidation once again. |
|
|
What Does Relative Strength Say? |
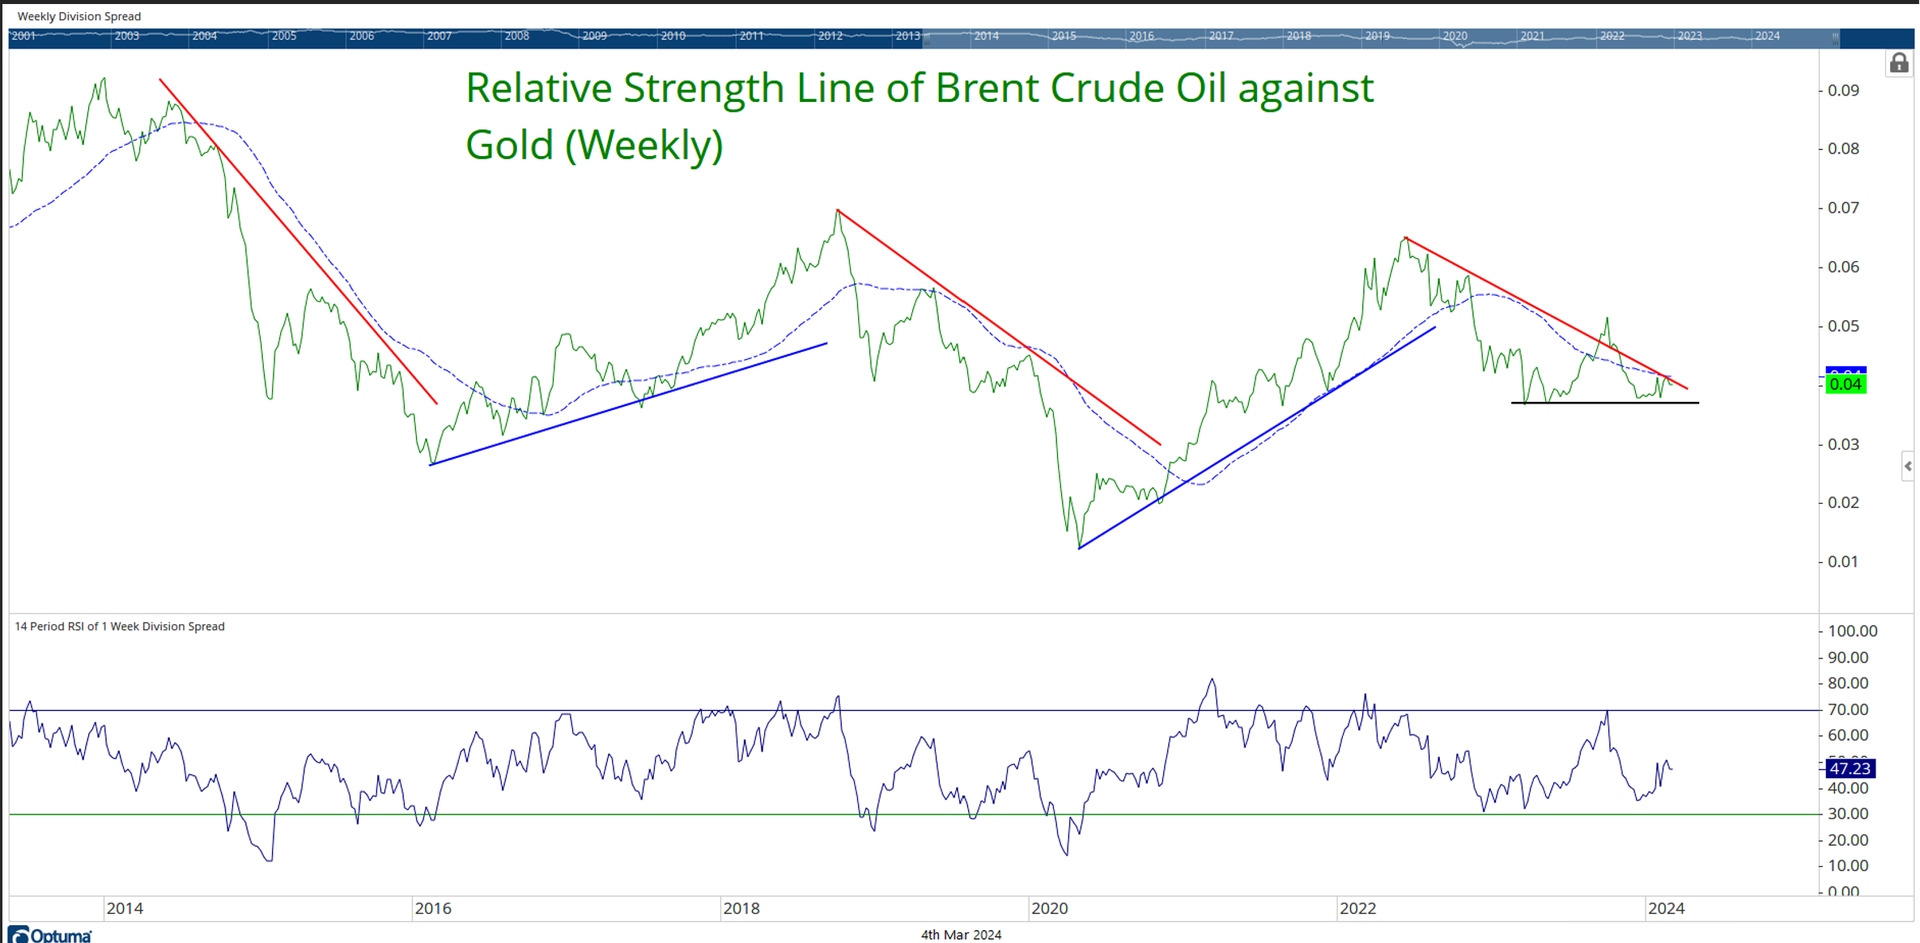
The relative performance of Brent Oil against Gold (XAUUSD) has its phases of up and down moves. Recently, by and large, while Gold has stayed relatively stronger against Brent, the RS line of Brent against Gold has flattened over the past couple of months. |
|
|
You are receiving this newsletter because you subscribed to the Chart Advisor newsletter. If you wish to unsubscribe, please click here. Dotdash Meredith 225 Liberty St, 4th Floor, New York, NY 10281
© 2024 All Rights Reserved. Privacy Policy | Terms of Service |
|
|
|