1/ Crude Oil Tests 200-Week MA |
2/ Short Term Expectations From Crude Oil |
3/ Precious Metal Stays Relatively Stronger |
4/ What to Expect From XAUUSD? |
5/ DXY Finds Support. Will It Hold? |
|
|
Investopedia is partnering with CMT Association on this newsletter. The contents of this newsletter are for informational and educational purposes only, however, and do not constitute investing advice. The guest authors, which may sell research to investors, and may trade or hold positions in securities mentioned herein do not represent the views of CMT Association or Investopedia. Please consult a financial advisor for investment recommendations and services. |
|
|
Crude Oil Tests 200-Week MA |
Courtesy of StockCharts.com |
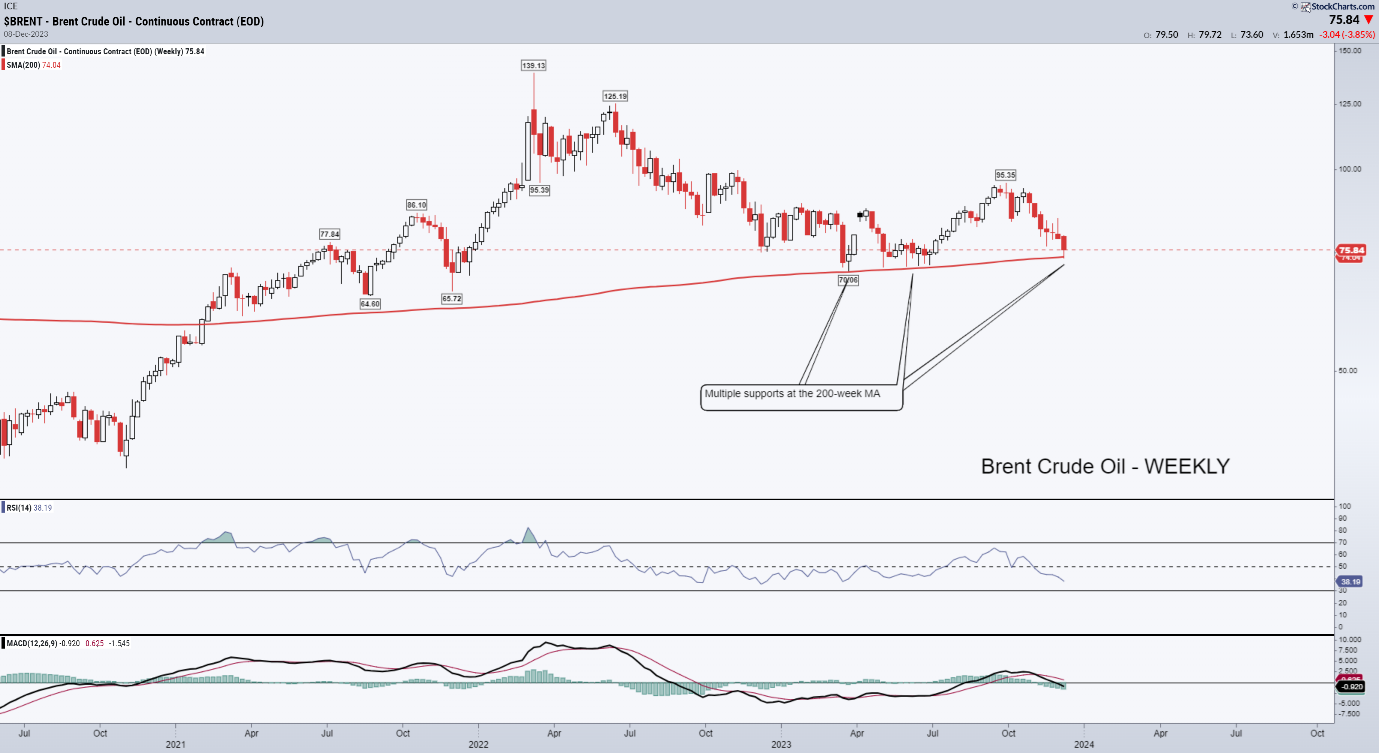
The week remained particularly weak for Brent Crude Oil. The commodity declined for the seventh week in a row as it lost yet another 3.85% on the weekly basis. From the most immediate swing high of $95.35, the Brent has come off over 20% from that point. From a technical perspective, crude has tested the important support of 200-week MA which is placed at 74.04. This was the point from where the commodity showed a mild technical rebound before closing at $75.84. |
|
|
Financial market research from professionals at the forefront of technical analysis innovation. |
|
|
Short Term Expectations From Crude Oil |
Courtesy of StockCharts.com |
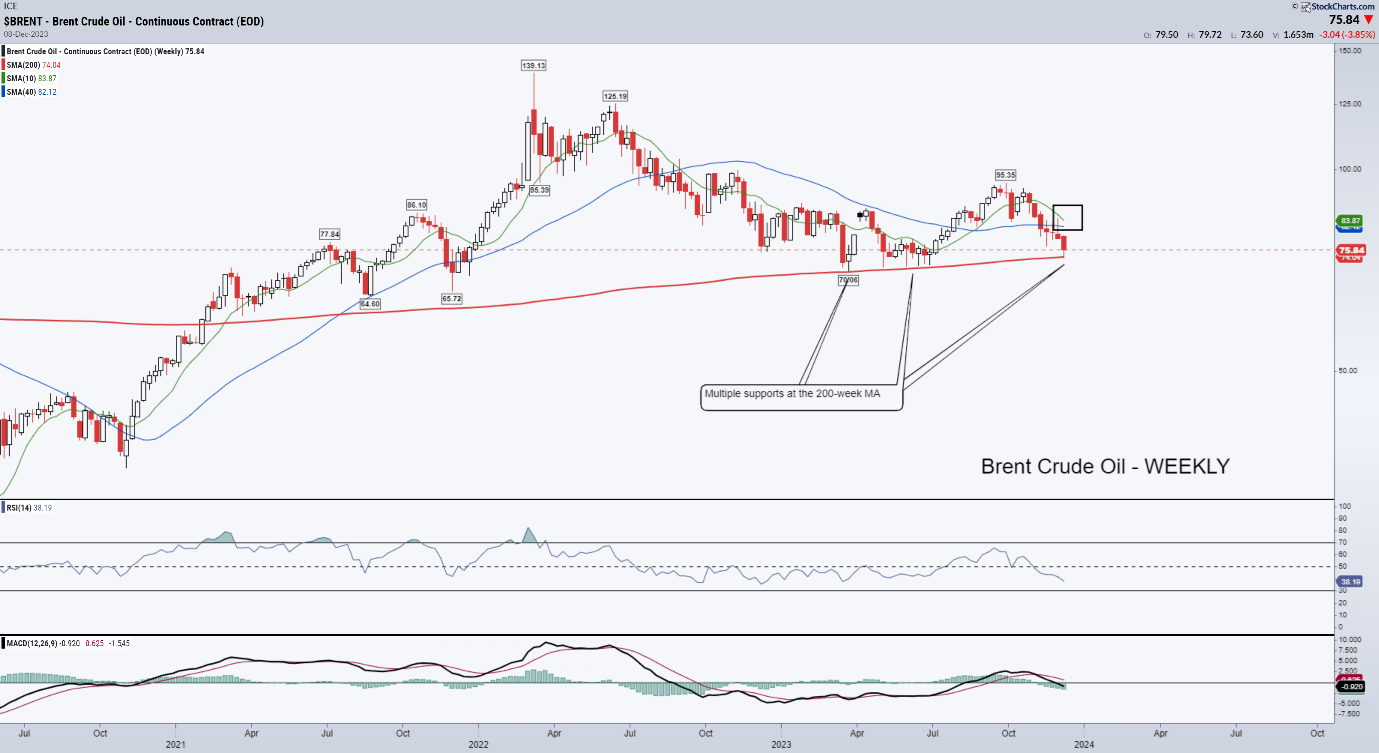
Undoubtedly, the 200-week MA which is currently at 74.04 can be expected to act as a strong support at Close for the Brent Crude unless of course meaningfully violated. The commodity can be expected to show some signs of stability and a technical rebound cannot be ruled out. This technical rebound, if and when it occurs, is likely to stay capped and limited in its extent. The commodity may find stiff resistance in the confluence zone of 10-week MA and the 40-Week MA which exists between 83.87 and 82.12. The crossovers of 10-, and 40-Week Mas have always had their impact on the price trajectory of the commodity. With these MAs moving towards a negative crossover (this would happen when the 10-Week MA will cross below 40-Week MA), the upsides and technical rebounds may find strong resistance here. Any violation of the 200-Week MA will make the commodity incrementally weaker. |
|
|
Precious Metal Stays Relatively Stronger |
Courtesy of StockCharts.com |
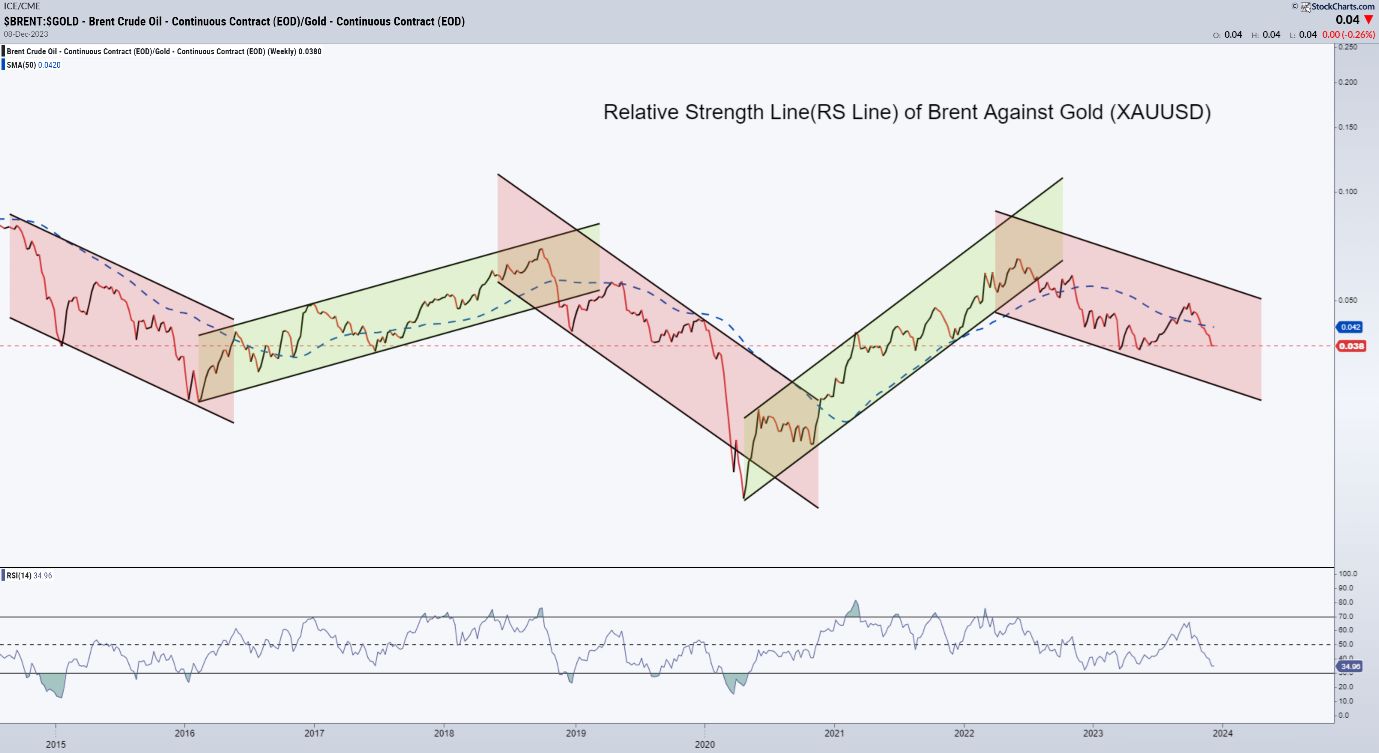
Brent Crude has had its phases of relative outperformance and underperformance when compared to Gold (XAUUSD). When the Crude Oil was compared against the precious metal, the Relative Strength Line (RS Line) is seen in a falling trajectory. The outperformance of the Oil against Gold peaked in the middle of 2022; since then, over the past year and a half, Brent Oil has been evidently underperforming the Gold. There is no wonder the precious metal has done well against Oil over the same time period. |
| |
What to Expect From XAUUSD? |
Courtesy of StockCharts.com |
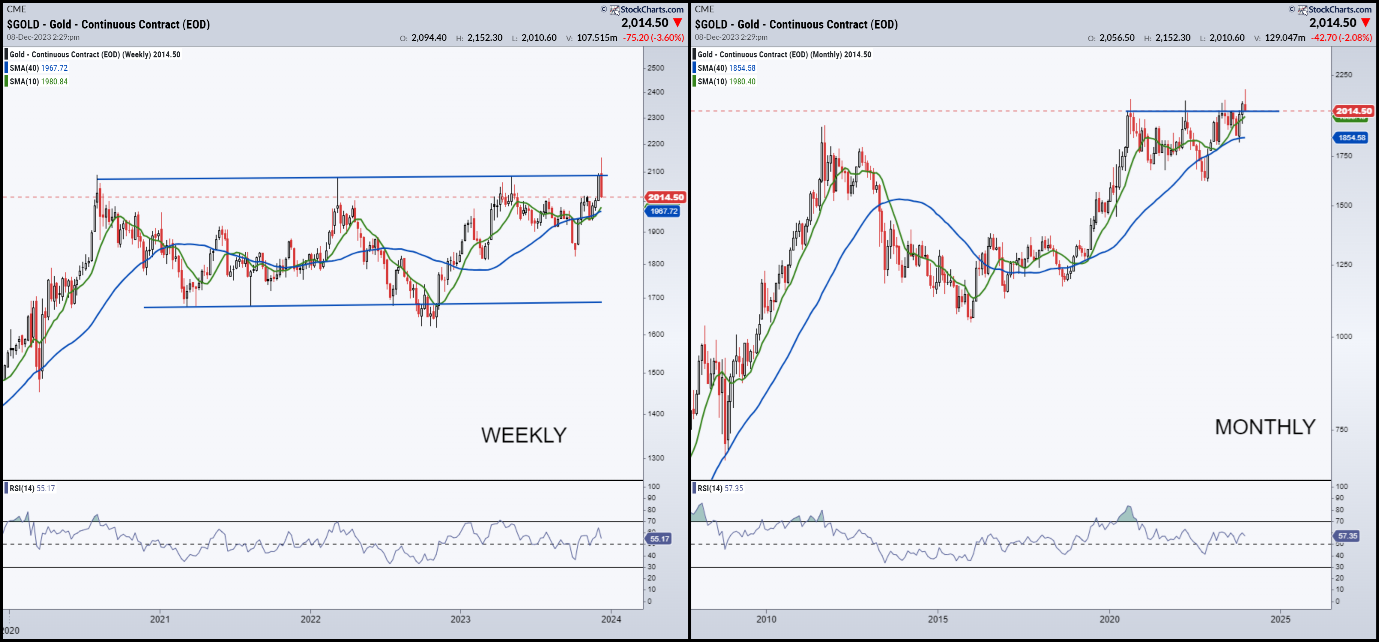
Gold (XAUUSD) has had a great year so far; the precious metal has gained 9.75% on a YTD basis. The last week also saw the precious metal marking a lifetime high of $ 2152 after which it retraced. Presently, the levels of 2070-2090 offer resistance the precious metal. In fact, since 2020, this zone has been tested four times. The long-term monthly chart shows that this zone has been tested over nine times. The most recent attempt to break above this has failed; this zone continues to remain a stiff resistance area for Gold. On the weekly chart, the 10-week MA has crossed above the 40-Week MA. Gold may stay stable and largely buoyant with the zone of 1960-1980 offering good support. We can fairly expect the precious metal to maintain its relative strength against Brent crude and perform well of the immediate short term. |
|
|
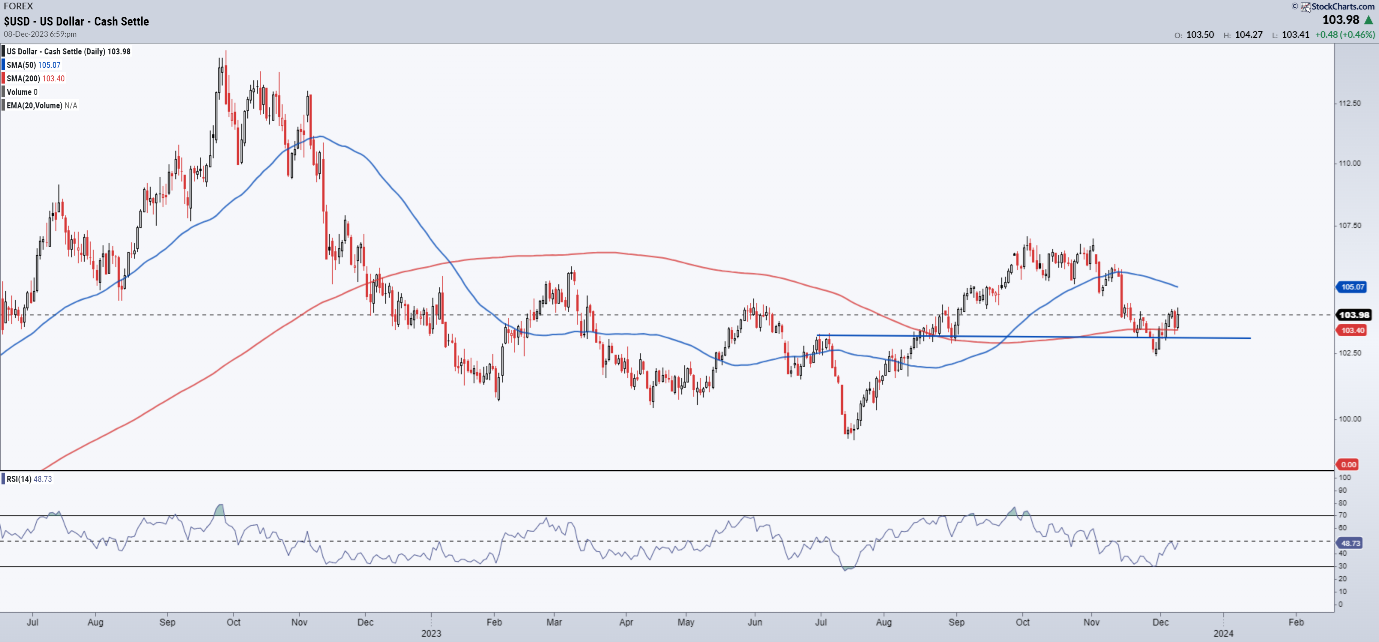
DXY Finds Support. Will It Hold? |
Courtesy of StockCharts.com |
The Dollar Index (DXY) has been weak following the Fed taking a pause with the interest rate hikes. The committee meets next on December 12 for the next Fed meeting and on December 13, they are largely expected to maintain a status quo. The DXY has a support at 103-103.40 levels; if this is violated again, it may get weaker and this may turn out beneficial for commodities and metals. |
|
|
Foram Chheda, CMT is a Technical Research Analyst anShe also serves as a volunteer on the CMT Association’s membership committee.d founder of chartanalytics.co.in. Foram frequently appears on CNBC Bajar, a part of the regional network of CNBC, the financial media group having one of the largest footprints across India. Foram is also seen regularly on ET Markets LIVE streaming where she shares her views on the Equity Markets. |
|
|
You are receiving this newsletter because you subscribed to the Chart Advisor newsletter. If you wish to unsubscribe, please click here. Dotdash Meredith 225 Liberty St, 4th Floor, New York, NY 10281
© 2023 All Rights Reserved. Privacy Policy | Terms of Service |
|
|
|