2/ Scouting for Trend Reversals in Overheated Markets |
3/ ALLE Inverse Head & Shoulder Patterns |
4/ Moving Averages and Pattern Analysis for Confirming Trend Reversals |
|
|
Investopedia is partnering with CMT Association on this newsletter. The contents of this newsletter are for informational and educational purposes only, however, and do not constitute investing advice. The guest authors, which may sell research to investors, and may trade or hold positions in securities mentioned herein do not represent the views of CMT Association or Investopedia. Please consult a financial advisor for investment recommendations and services. |
|
|
Trend reversals in technical analysis denote a shift in the prevailing direction of a financial asset's price movement. Identifying trend reversals is crucial for traders and investors aiming to make informed decisions. Typically signaled by technical indicators, chart patterns, or key support/resistance levels, these reversals indicate a change from an existing uptrend to a downtrend or vice versa. Recognizing the early signs of a reversal is essential for capitalizing on potential market shifts and adjusting trading strategies accordingly. |
|
|
Financial market research from professionals at the forefront of technical analysis innovation. |
| |
Scouting for Trend Reversals in Overheated Markets |
Courtesy of StockCharts.com |
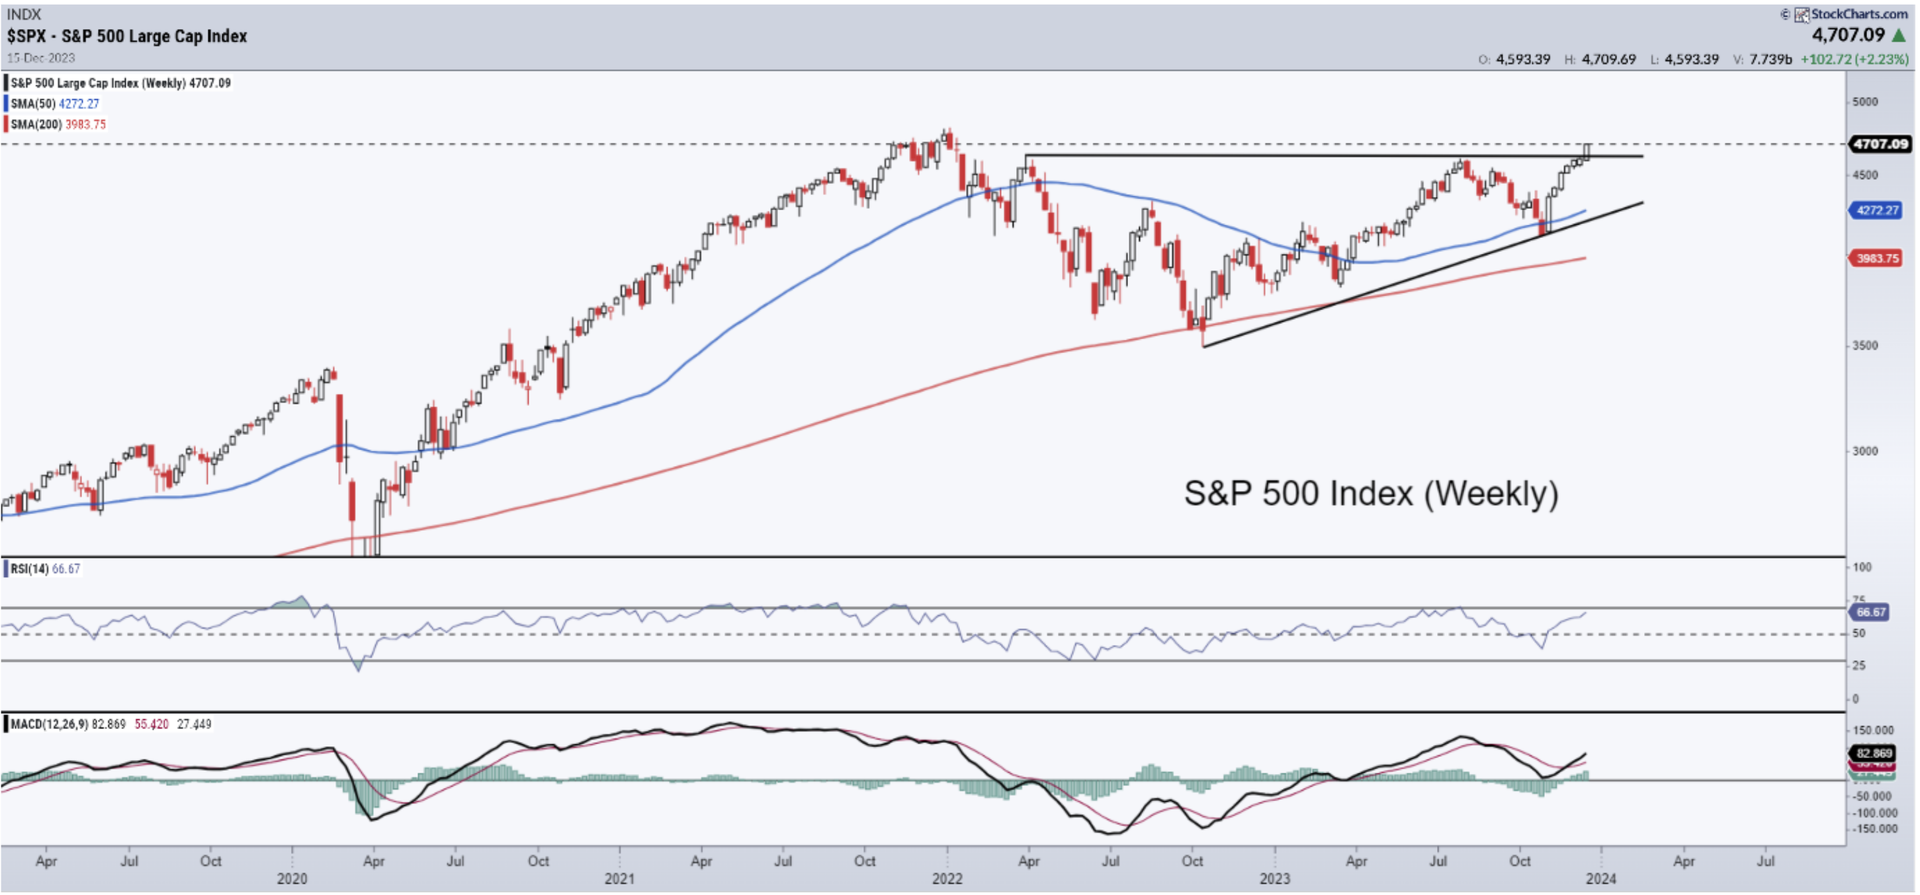
The markets are in a firm grip of the bulls; SPX looks set to scale greater heights as it breaks out from a bullish ascending triangle spanning almost a year and a half. However, on the daily chart, the markets look quite overheated, especially after the Fed kept the rates unchanged and further hinted at rate cuts in 2024. On the daily charts, markets look overstretched as they head for the seventh consecutive week of gains. This is the time when one needs to manage risks, get out of the stocks that have steeply run ahead of the curve, and more importantly move to stocks that appear to be laying the ground for a fresh up move. In overheated and steeply overbought markets, identifying stocks that underperformed but exhibit signs of a trend reversal is essential for risk management and capitalizing on potential opportunities. When the overall market is saturated with overbought conditions, stocks that have lagged may present more favorable risk-reward profiles. Scouting for these underperformers with indications of a trend reversal allows investors to potentially enter positions at more favorable valuations, taking advantage of the correction or reversal in market sentiment. |
|
|
Inverse Head & Shoulder Patterns |
Courtesy of StockCharts.com |
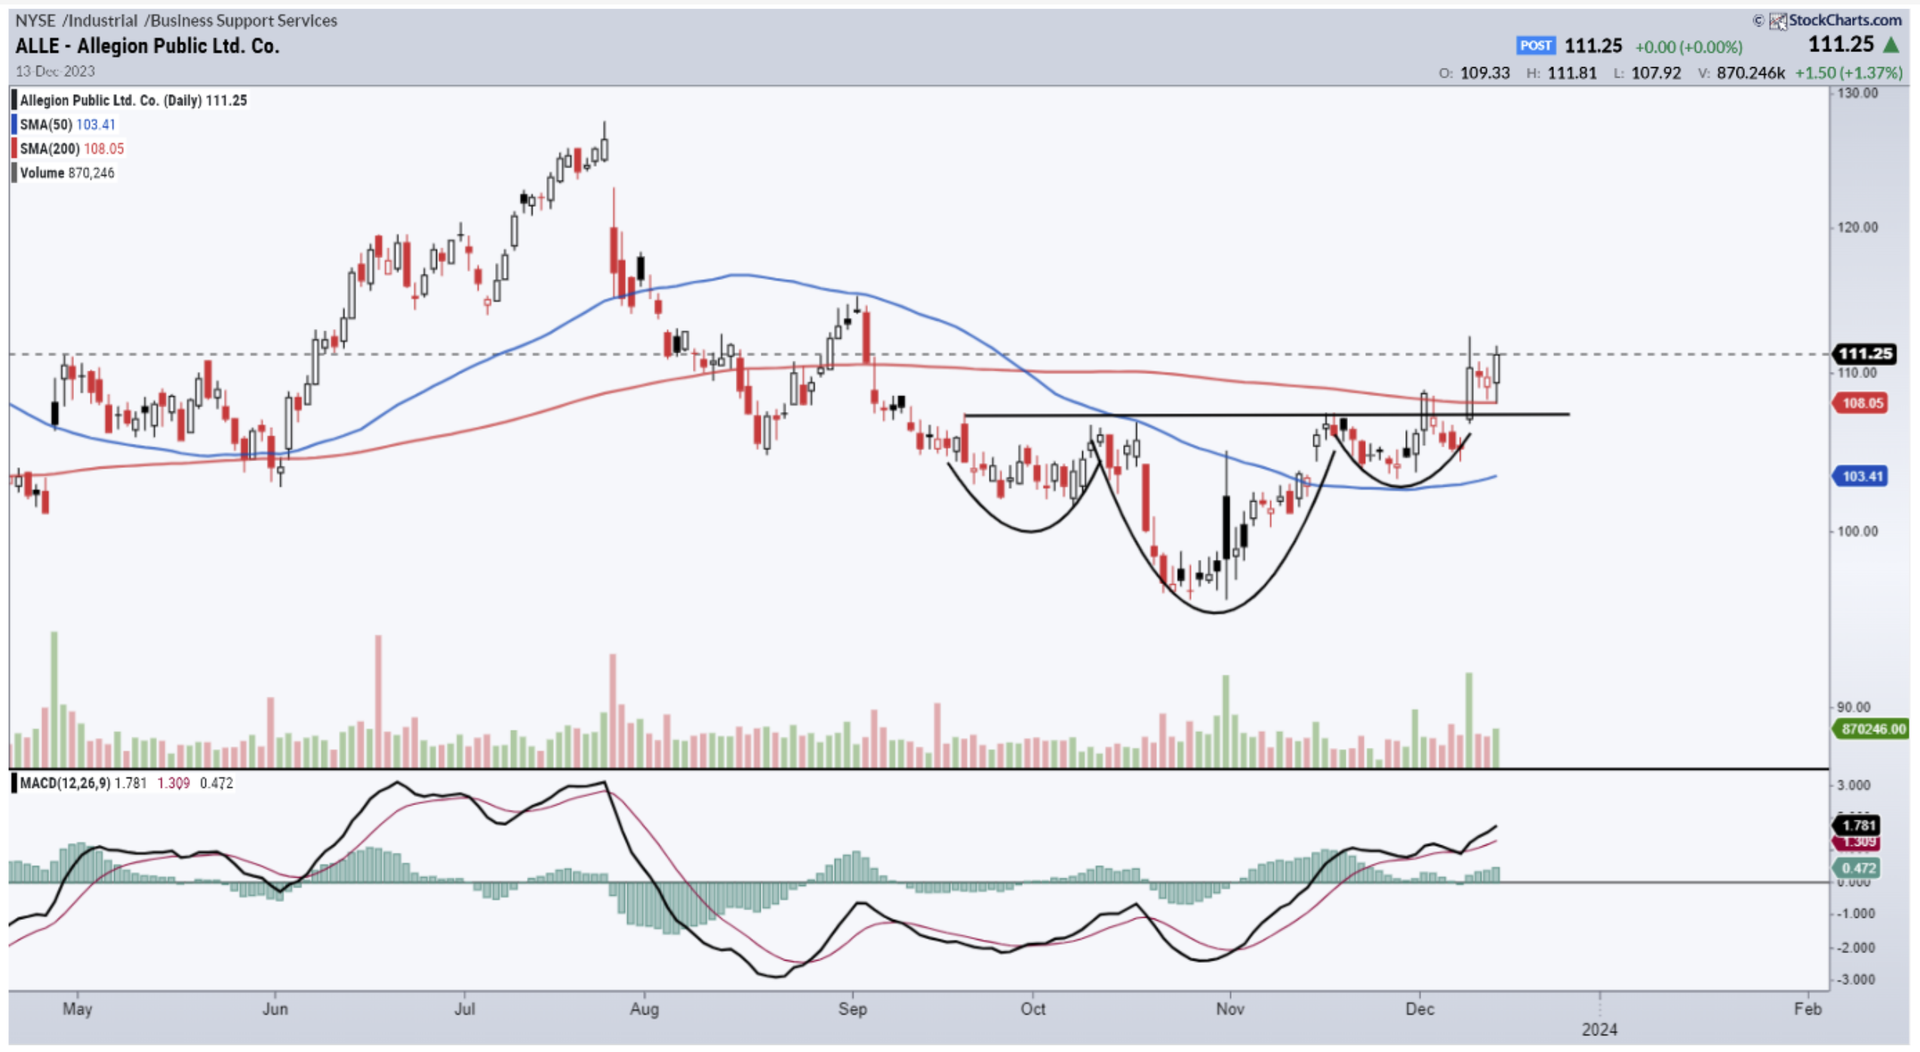
ALLE has broken out from a bullish Head and Shoulders pattern. The Inverse Head and Shoulders pattern is a bullish reversal pattern in technical analysis. It consists of three lows, with the middle trough (head) being lower than the surrounding two (shoulders). The pattern signals a potential trend reversal from a downtrend to an uptrend. Traders typically look for a breakout above the neckline, which connects the highs of the two shoulders, to confirm the reversal. This pattern is considered a bullish indicator as it suggests that the asset's price may move higher after the completion of the pattern, providing traders with a potential buying opportunity. ALLE has not only broken out from this bullish reversal pattern, but it has also crossed and closed above the 200--DMA. From the technical price measurement implications, so long as ALLE keeps its head above 107 levels, it has the potential to test 115 and 118 levels over the coming days. |
| |
Moving Averages and Pattern Analysis for Confirming Trend Reversals |
Courtesy of StockCharts.com |
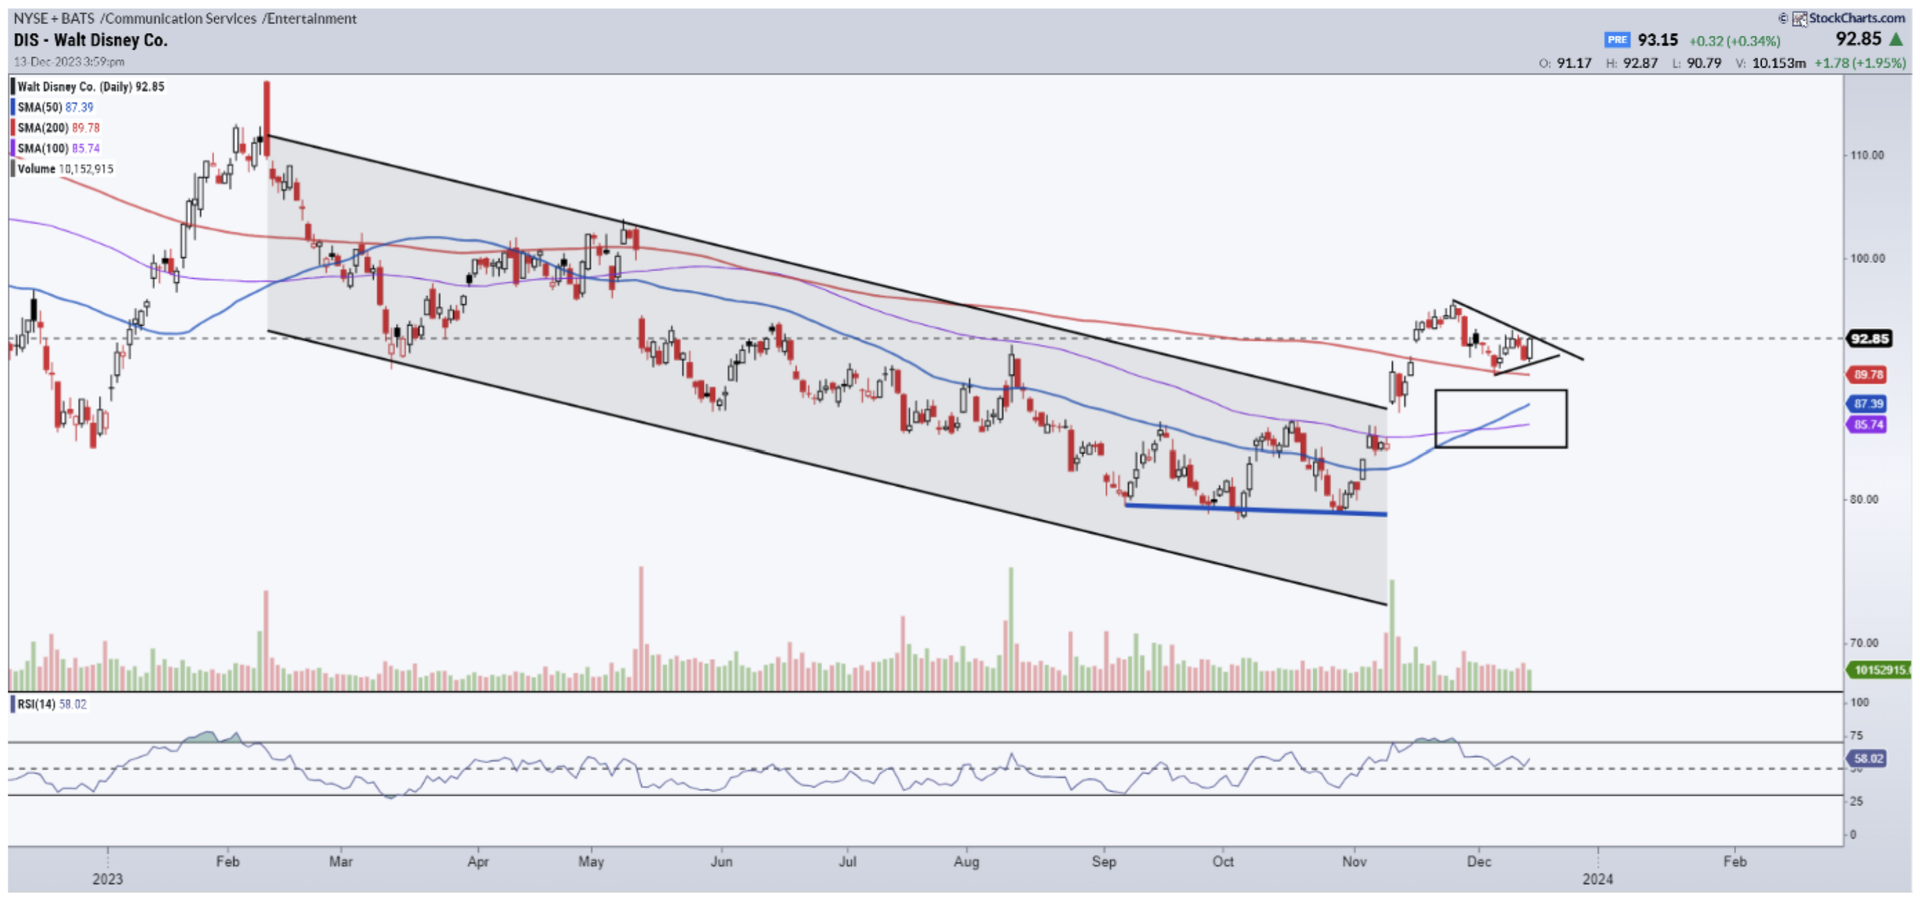
Moving averages crossovers (eg., 50-period MA crossing above 100-period MA) and pattern analysis (e.g., Channel breakouts) are concise yet potent methods for detecting trend reversals. These tools enable traders to swiftly identify potential shifts in market direction by analyzing both short-term moving average dynamics and distinctive chart patterns. Precisely in this case, DIS stayed in a secular multi-month downtrend where the price kept moving lower and remained in a falling trajectory inside a falling channel inside which the price kept making lower peaks and lower troughs. A base was formed where the price made a minor double-bottom and inched higher eventually breaking out of the falling channel. DIS has also seen its 50-DMA crossing above 100-DMA indicating a return of momentum. The price now trades above all key moving averages. The current technical setup suggests that given the current structure, the stock is set to inch higher towards 95 and 98 levels over the coming days. |
|
|
Foram Chheda, CMT is a Technical Research Analyst anShe also serves as a volunteer on the CMT Association’s membership committee.d founder of chartanalytics.co.in. Foram frequently appears on CNBC Bajar, a part of the regional network of CNBC, the financial media group having one of the largest footprints across India. Foram is also seen regularly on ET Markets LIVE streaming where she shares her views on the Equity Markets. |
|
|
You are receiving this newsletter because you subscribed to the Chart Advisor newsletter. If you wish to unsubscribe, please click here. Dotdash Meredith 225 Liberty St, 4th Floor, New York, NY 10281
© 2023 All Rights Reserved. Privacy Policy | Terms of Service |
|
|
|