1/ DXY Flat; Commodities and Equities Rise |
3/ Precious Metals Stage a Major Breakout |
4/ GLD breaks out; Shows Improvement in Relative Momentum |
|
|
Investopedia is partnering with CMT Association on this newsletter. The contents of this newsletter are for informational and educational purposes only, however, and do not constitute investing advice. The guest authors, which may sell research to investors, and may trade or hold positions in securities mentioned herein do not represent the views of CMT Association or Investopedia. Please consult a financial advisor for investment recommendations and services. |
|
|
DXY Flat; Commodities and Equities Rise |
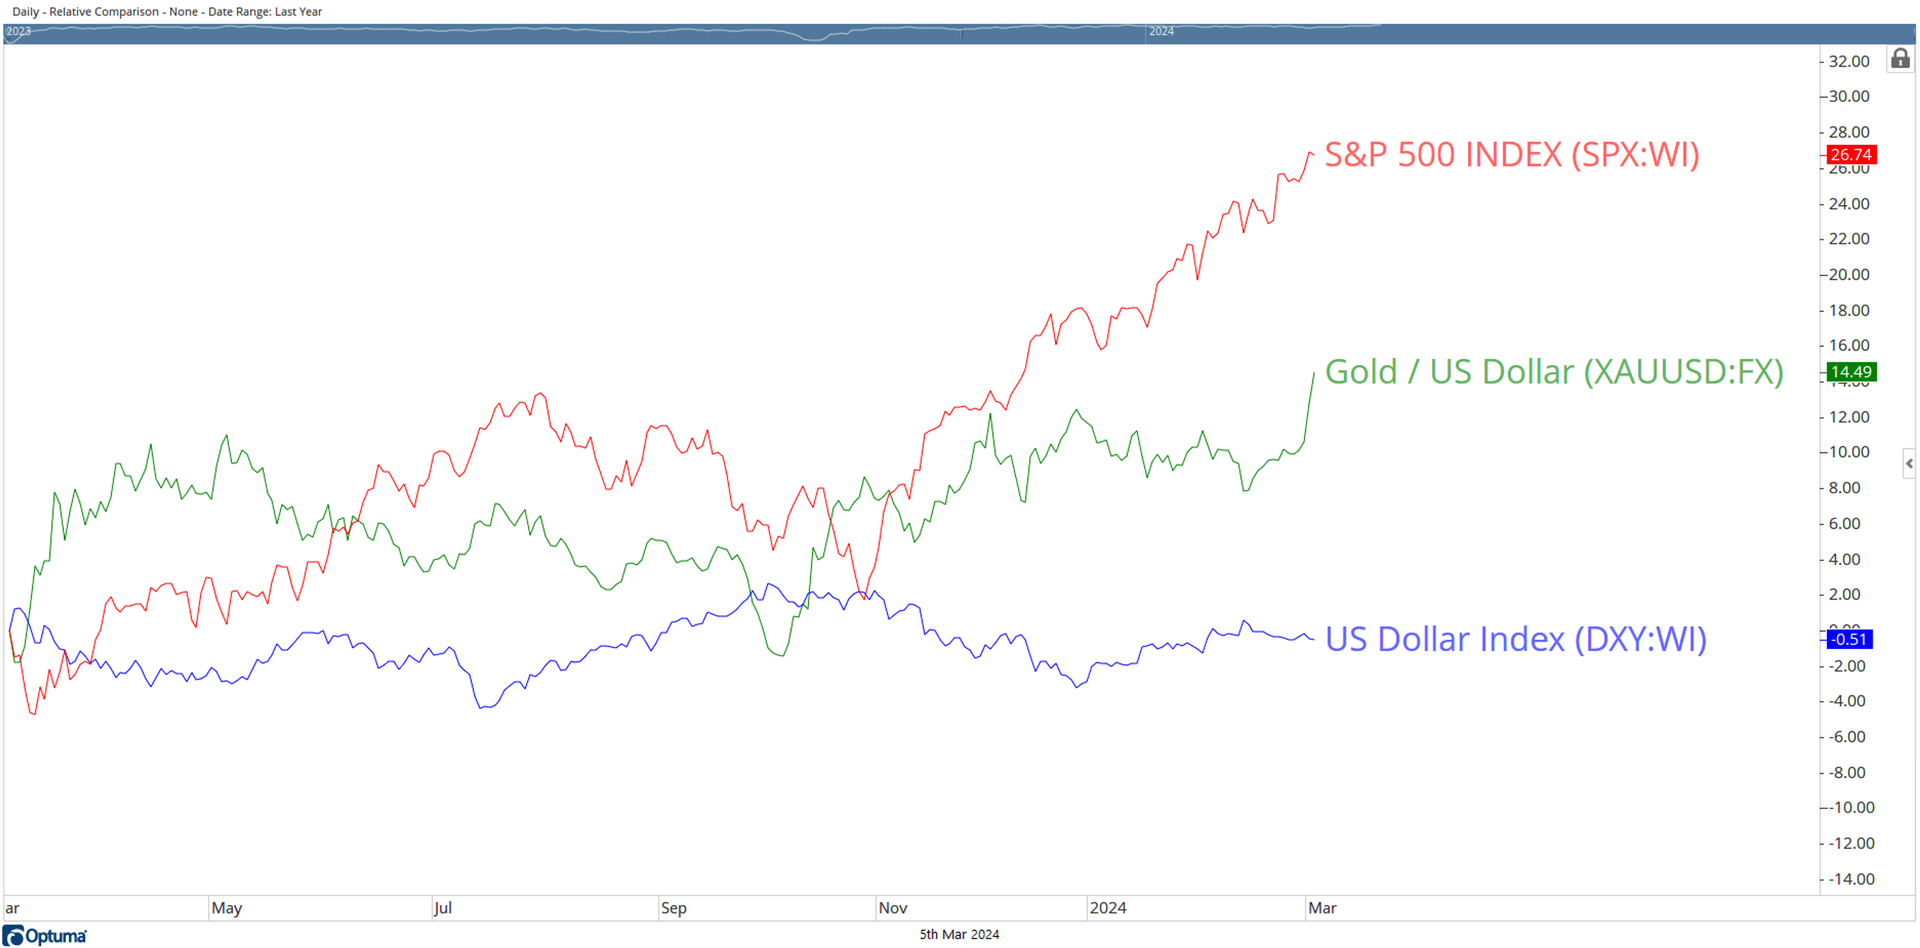
Going by the rules of Intermarket analysis and the set relation between currencies and commodities, a weak US Dollar generally aids commodities like Gold. However, over the past twelve months, DXY hasn’t changed much; it has stayed flat, and yet Gold has strengthened based on pure technicals. The Relative Comparison of Gold, Equities (represented by the S&P 500 Index), and the US Dollar Index shows that the DXY has stayed flat; it has lost just 0.51% over the past year. However, Gold (XAUUSD) gained 14.49% annually while Equities returned a whopping 26% over the same period, i.e., past twelve months. |
|
|
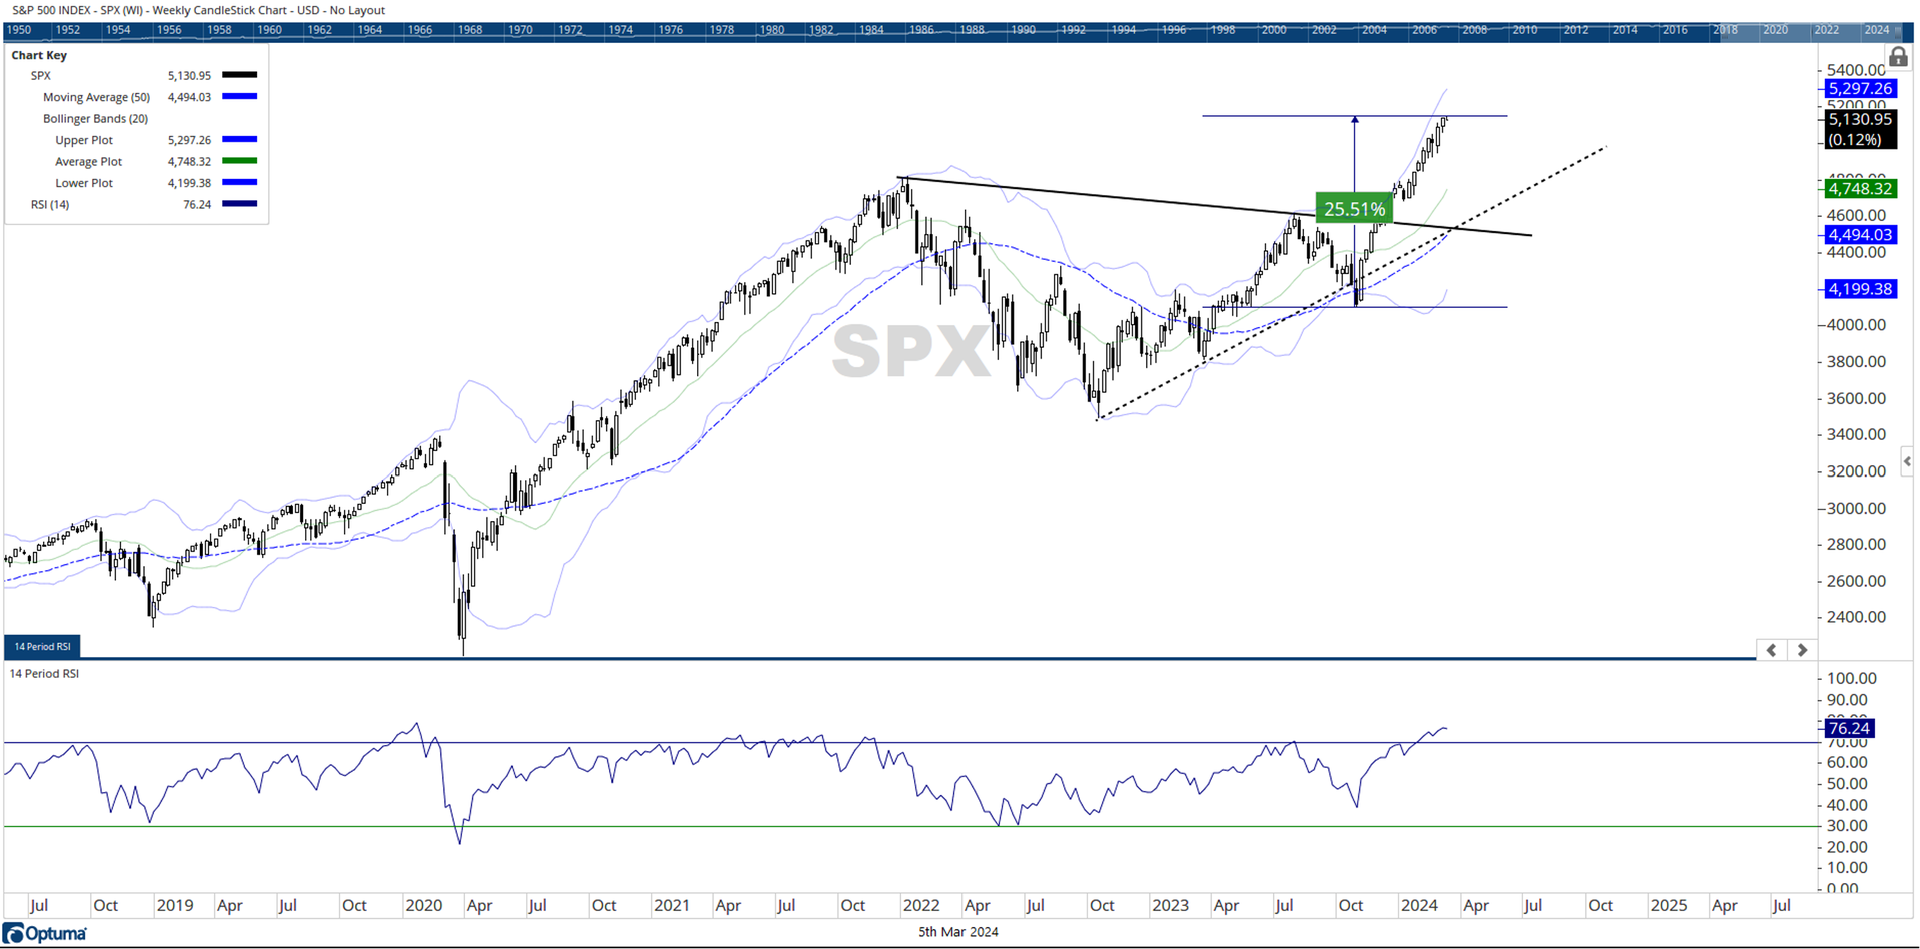
Taking the Relative Comparison further, let us zoom in on Equities. The S&P 500 Index may have gained over 26% over the past twelve months. However, all those gains have come in just the last six months. From the most recent lows of 4103 seen in October last year, this broad market Index has gained over 25.51% over just the last five months. This one-way parabolic rise has seen the Bollinger bands getting wider beyond normal and has created a bulge. This bulge has the potential to kill this trend, or at least halt the trend and push the equities under some consolidation. Also, there is a serious deviation from the mean. The 50-week MA is currently at 4494, which is 14% below current S&P 500 levels. This makes some room for mean reversion as well. |
|
|
Precious Metals Stage a Major Breakout |
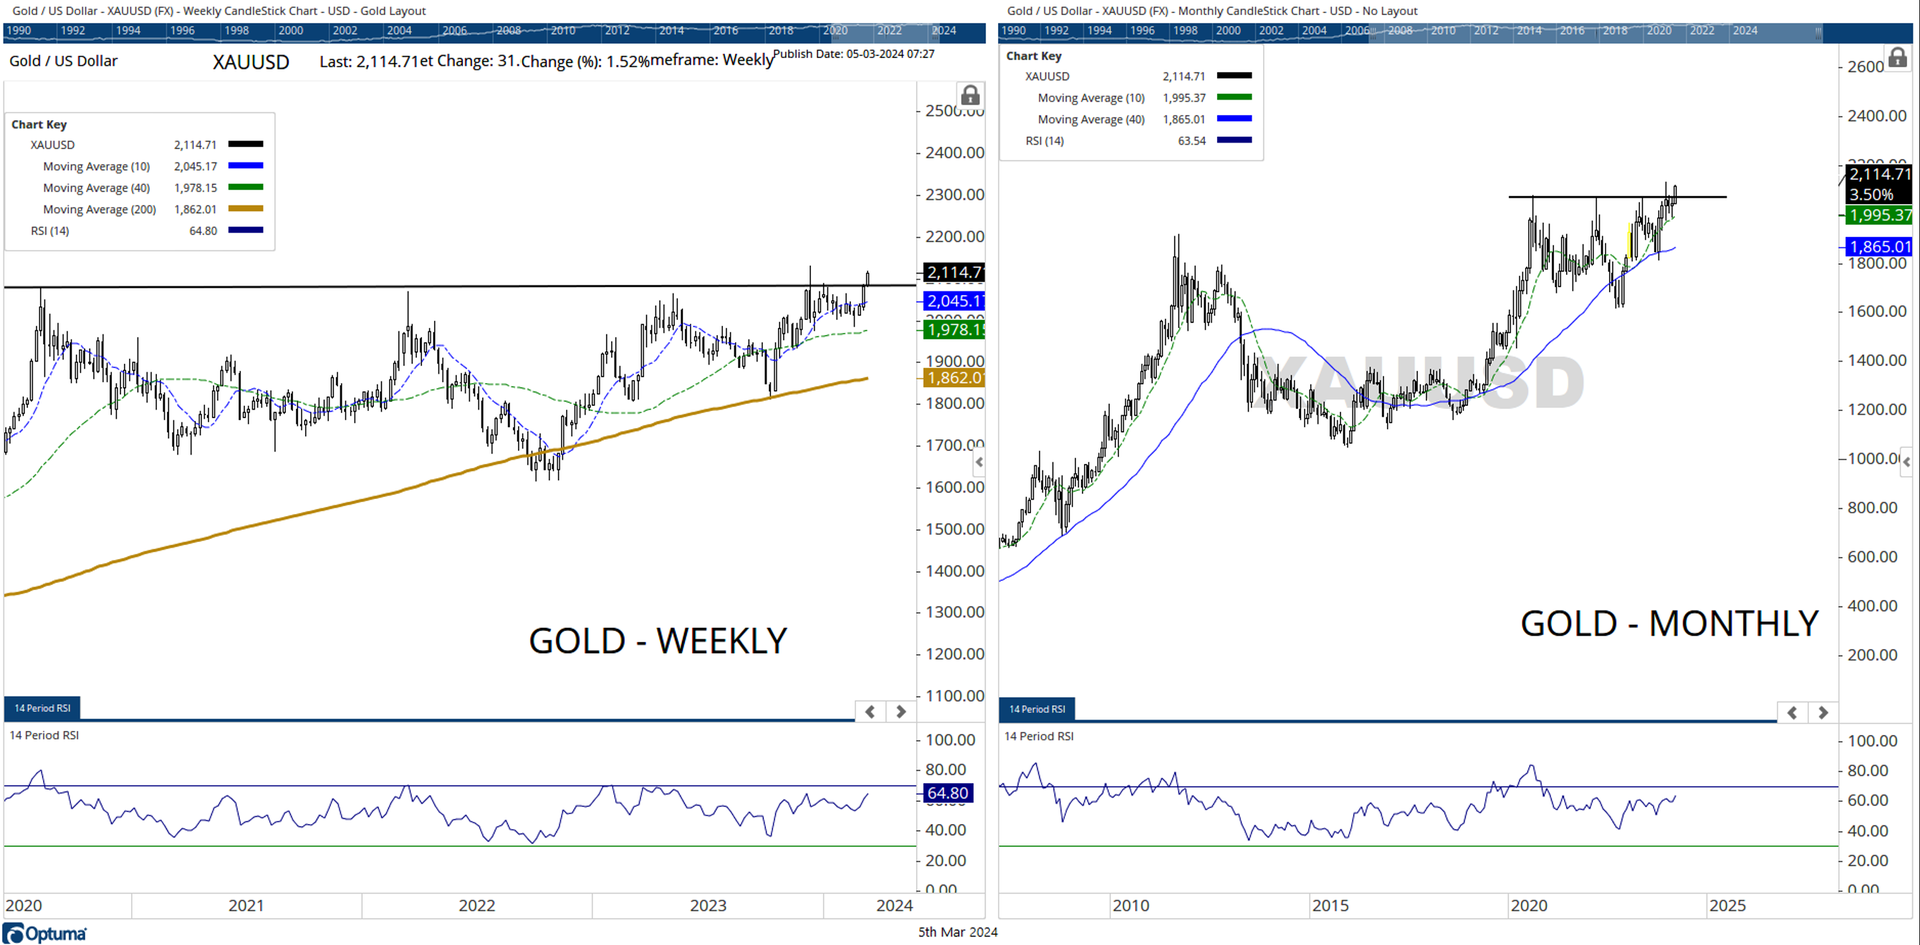
Gold (XAUUSD) has staged a major breakout on major time frames. It shows a strong thrust on both weekly as well as monthly charts. Though the bar on each of these timeframes is incomplete, it makes a solid case for future sure in Gold if the precious commodity keeps its head above 2000-2040 levels. |
|
|
GLD breaks out; Shows Improvement in Relative Momentum |
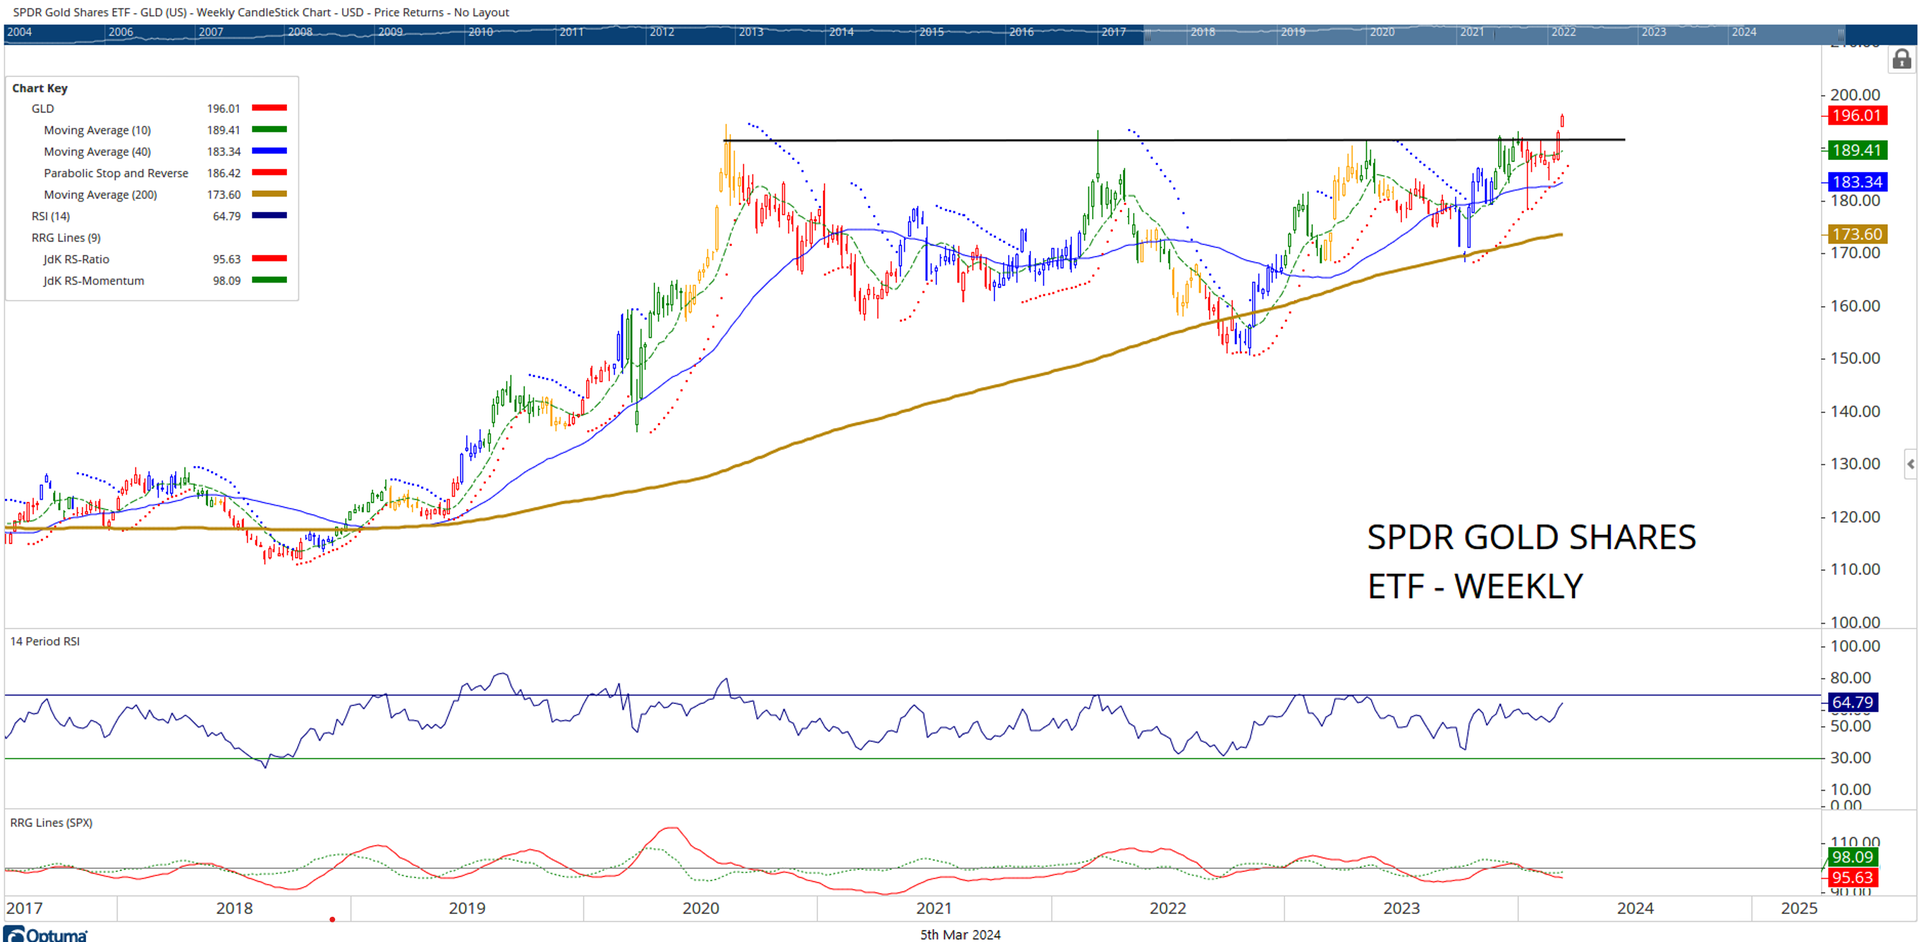
Gold ETF – SPDR Gold Shares ETF (GLD) invites fresh entry opportunities. This ETF has staged a breakout as it crossed above the $ 190 level. The RSI marks a new 14-period high; it stays neutral while not showing any divergence against the price. Importantly, the chart is plotted with the color of RRG Quadrants while benchmarking the Gold ETF (GLD) against the equities, i.e., the S&P500 index. Even while GLD breaks out, the color of the bar is still red hinting at the placement of GLD in the lagging quadrant. However, if we look at the trajectory of the tails in the lower pane, it is quite evident that the green line is seen inching higher. This shows that GLD is improving its Relative Momentum against equities; once JdK RS Momentum crosses above 100, it may mean a potential beginning of a phase of relative outperformance of the commodity against the equities. |
|
|
You are receiving this newsletter because you subscribed to the Chart Advisor newsletter. If you wish to unsubscribe, please click here. Dotdash Meredith 225 Liberty St, 4th Floor, New York, NY 10281
© 2024 All Rights Reserved. Privacy Policy | Terms of Service |
|
|
|